Some cycles due in 2015

So you can be prepared, if you wish, here are some cycles due in 2015. One of them is gigantically important to both the political and financial worlds, so I hope my exposition is clear.

The first cycle is very easy to understand: something economically important really hits the fan every seven years. Going in reverse from here, seven years at a time:

  • 2008, start of the Great Recession, first real estate debt bubble pop;
  • 2001, recession begins as part of 2000-2002 internet/tech stock bubble pop;
  • 1994, worst year for bond markets in modern history;
  • 1987, the famed stock market Crash of ’87;
  • 1980, inflation, the “Misery Index”, start of a major recession that doesn’t go away for three years;
  • 1973, Arab Oil embargo, start of a major recession;
  • […] you get the idea.

The article at this link talks more about this cycle, including the note that the years in this seven-year cycle that coincided with an Autumn solar eclipse (1931 and 1987) had particularly strong events; and 2015 does have two solar eclipses. Again, from the article at the link:

In 1931, a solar eclipse took place on Sept. 12…Eight days later, England abandoned the gold standard, setting off market crashes and bank failures around the world. It also ushered in the greatest monthlong stock market percentage crash in Wall Street history.

In 1987, a solar eclipse took place Sept. 23…Less than 30 days later came “Black Monday” the greatest percentage crash in Wall Street history.

Some great forecasters think that March is a strong candidate for significant financial turbulence in 2015, and there is a total solar eclipse on March 20. And there is a partial solar eclipse on September 13, a better calendar correspondence with the events referenced in the quote above. So maybe we’ll get two strong events this year.

For those of you who believe what you read in the US media, perhaps you are wondering how we could get major financial problems when things are allegedly so “awesome.” Well, sorry to tell you, but even Goldman “doing God’s work” Sachs just admitted that the world economy has gone into contraction:

     It’s Official: Global Economy Back In Contraction For First Time Since 2012 According To Goldman 

(As a side note, Al Jazeera did a great video on true nature of Goldman Sachs. The link is here, but, if you are in the USA, the censors won’t allow you to view the video in the “Land of the Free” US, it’s only playable outside the US. A lot of that type of thing is going on these days. It’s a small part of what has dropped the US down to 49th globally in press freedom; see World Press Freedom Index Plunges – USA Now Ranked #49 Globally.)

If this seven-year cycle repeats in 2015, then I think we can easily predict what the authorities will do since it seems to be the only thing they know how to do when there’s trouble: print more money by creating more debt! But as explained in The deflationary wave intensifies, this strategy has become counter-productive and is locking the world economy in a deadly stranglehold.

Some realize all this and some do not. But this brings us to our second cycle: Martin Armstrong’s Sovereign Debt Big Bang. Here is a slide of Armstrong’s forecasts from a conference in early 1998:

Armstrong1998-Forecast

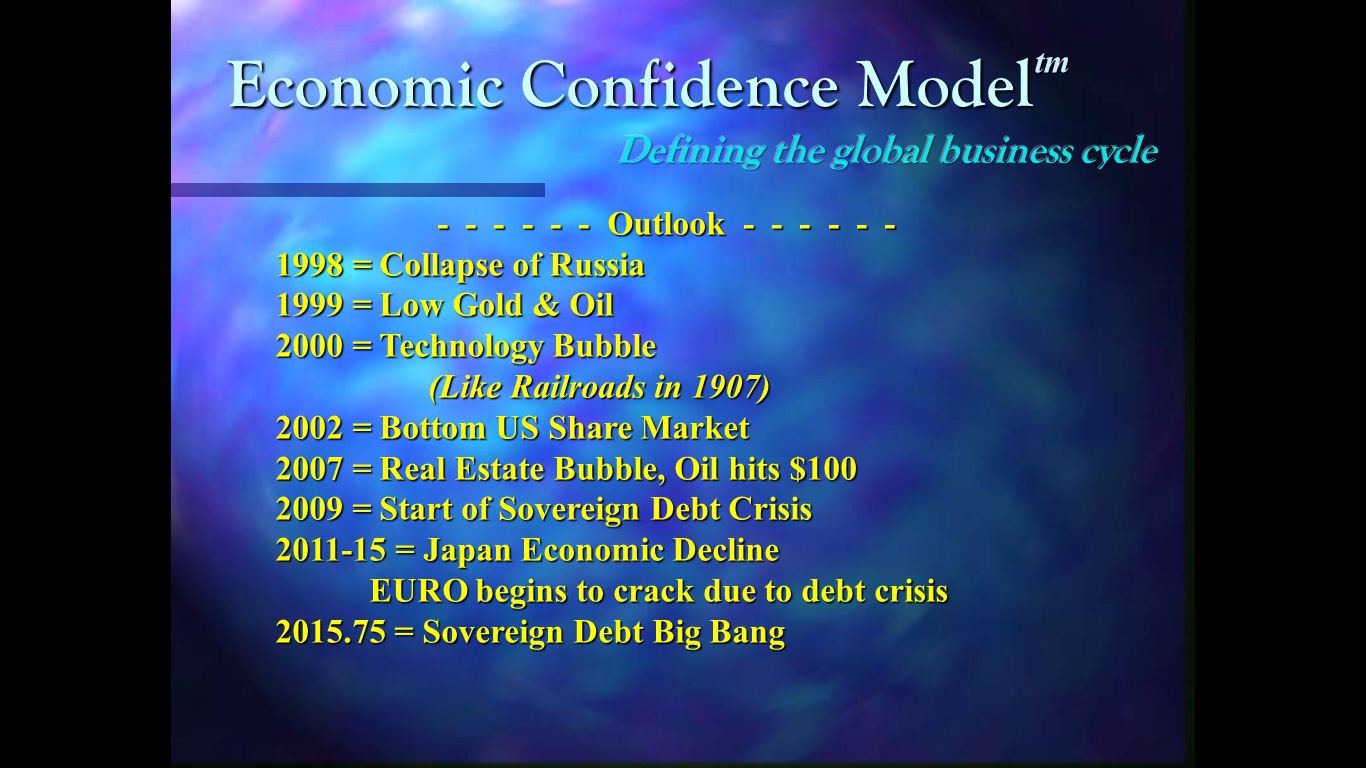
(Source, from Martin Armstrong’s blog)

These major forecasts all came true. The only one left to go (2015.75 = September 30, 2015) is the Sovereign Debt Big Bang. What it says in that the tide will monumentally shift away from confidence in government bonds starting on September 30, 2015. Currently, confidence in government bonds is so high that people are buying them even with negative interest rates. The easiest way to understand interest rates is that they are the rental charge for lending someone money. So you rent someone $100 and you hope to get back maybe $103, the original $100 plus $3 of rent. But people are now buying government bonds even though they get back less money than what they lent to some government in the first place. They are paying governments to lend them money!

     16% Of Global Government Bonds Now Have A Negative Yield: Here Is Who’s Buying It

That was a few weeks back, at which point JP Morgan calculated that $3.6 Trillion worth of government bonds were paying negative interest rates. Some of the countries involved were Germany, Switzerland, Japan, Netherlands, Sweden, and Denmark. In Denmark, because interest rates went negative, some adjustable rate mortgages are now paying interest to the people who took out the mortgage!

     In Denmark You Are Now Paid To Take Out A Mortgage

Now you might say: Why would anyone buy a government bond with a negative interest rate?!?! When I first said we should expect negative interest rates in More shackles readied for deploymentI did get a few e-mails politely suggesting that I might want to get checked for dementia. Here’s what was said:

The policy is that savers will soon be hit with negative interest rates…So people would have to pay the bank interest on their own savings. So if the negative interest rate were -3%, if you had $100 in your account, you’d have to pay the bank $3 in interest.

This is crazy. Most people alive today think governments never default on their debt.  But that’s just plain wrong. Here is a chart showing country debt defaults going back to 1800. And this chart only shows those countries that have defaulted at least four times, the rest are not shown. Note that the list includes supposed stalwarts like Germany:
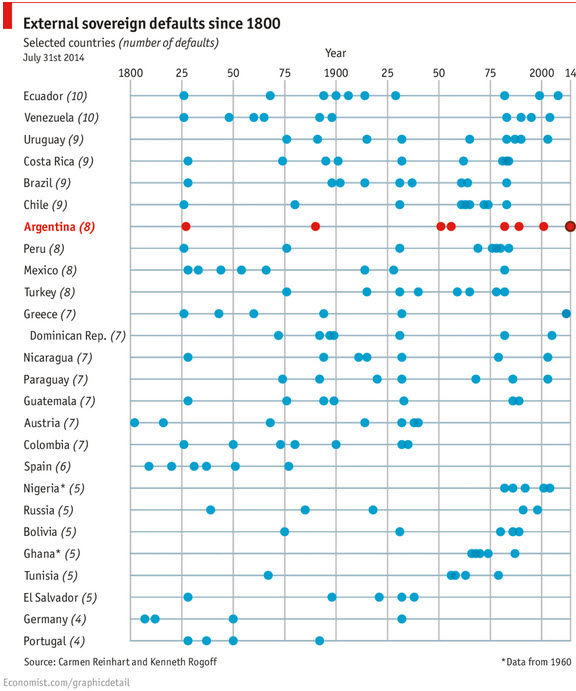
Sov20140731_default

(Chart sourcefrom The Economist.)

What Armstrong is saying–and he has been saying it since the 1990’s and has strong mathematical/historical models backing up his forecast–is that, near the end of this year, the world at large is finally going to wake up and understand the insanity of all this government borrowing. Not all at once, but relentlessly. They will see that most if not all countries are not going to pay back what they borrowed. They can’t. They don’t have the money. Greece is the first country to forthrightly admit it. One of the pompous Eurocrats threatened Greece last week, saying “If you don’t do what we say, Greece will go bankrupt.”  To which the Greek Finance Minister Yanis Varoufakis replied, “Greece is already bankrupt.”  (Straight truth! From a politician! Finally! Maybe that will become a trend!)

So what will this do to those who own all these government bonds? Who does own them anyway? For one, most of what is called capital at banks is government bonds. So there go the banks: no capital, insolvent. (Watch out for the upcoming bail-ins if you still keep money in banks.) Insurance companies and both government and private pension funds are huge holders of government bonds. So there goes insurance, and pensions. A well-placed German friend says that several European insurance companies are on the verge of bankruptcy. All of the assets of the US Social Security system, for example, are US government bonds: that’s all they own!

And somehow, the financial system has come to accept government bonds as collateral for other loans and bets. The $1 Quadrillion (that’s 1,000 Trillions) world derivatives casino market floats on a thin veneer of government bonds as “collateral” for these bets. Before the US defaulted on its debts in 1971 when Nixon said they were no longer payable in currency backed by gold, as previously promised, but now were backed by promises alone, collateral meant something real. For example, when you have a mortgage, your house is the collateral. A car is the collateral for an auto loan. But now in the financial world, someone’s promise to pay back a loan that they can never repay counts as collateral for even more loans. This is insane. Starting later in the year, a lot more people will start to understand that. That’s the nature of this Big Bang cycle. And there will be major repercussions. We talked about the demise of banks, pensions, and insurance. The derivatives collapse will take down all the brokerages and investment banks. So where will people get money?

Governments love to hide the truth about their historical defaults on their debt. Thus everyone is taught that the “cause of the Great Depression” of the 1930’s was the 1929 stock market crash. Total BS. The stock market crash wiped out stock speculators. That wasn’t a truly big deal. What took down thousands of banks were defaults on government bonds they and their customers were holding. Let’s look at that government bond default chart again. This time there is a red box around the worldwide wave of country debt defaults in the early 1930’s that wiped out thousands of banks and millions of savers:

Sov20140731_defaultBox

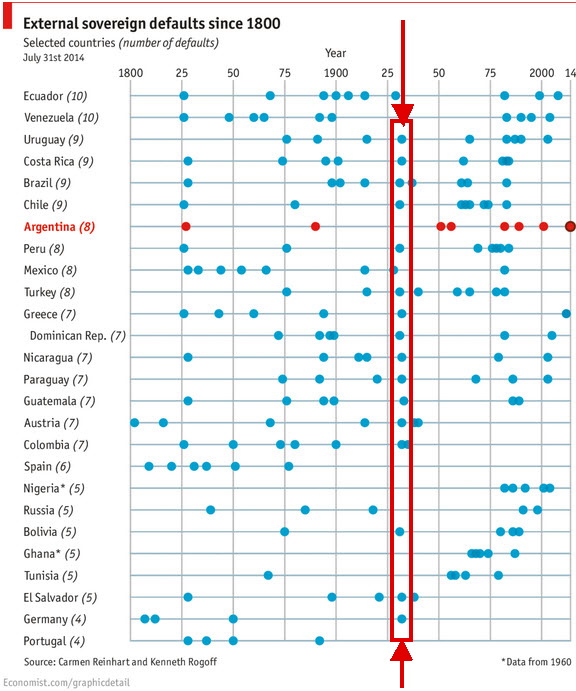
Get it? That’s what’s coming up again, only this time it will be worse. Way worse. There’s been far more borrowing, far more leverage, and all of it is floating on paper and electronic currencies and promises. The link to reality–gold–was removed in 1971.

World-Debts

Now some people say all this unpayable debt can be wiped off the books in a debt jubilee, like they used to do in Old Testament times. Well that’s true. It can. The problem is that anyone who put money in a bank account needs to realize that they have loaned that money to the bank. It’s a debt of the bank, they owe you money. And your deposit is backed by government debt, not by actual cash. So, if there were a debt jubilee, no one would have any money in their bank account anymore. Same for businesses, so no business would be able to write a paycheck to anyone. ATM’s would not be able to dispense any cash. Credit cards would no longer work. All of the money in the world is someone’s debt to someone else. So a debt jubilee would mean there was no money.

So now, do you want a debt jubilee? Of course not. But we are going to get one anyway. Not on purpose. By accident. Starting in a big way later this year.

Why can anyone be confident that this is true? Well first, go back and look at the rest of the predictions on Armstrong’s slide from 1998. Second, it’s already starting to happen. Greece, Argentina, Puerto Rico–the dominoes are starting to fall. Japan is a financial basket case, there is no way they can repay their debts, and they have the second largest pile of government debt on the planet. The whole world has gone wild for debt!

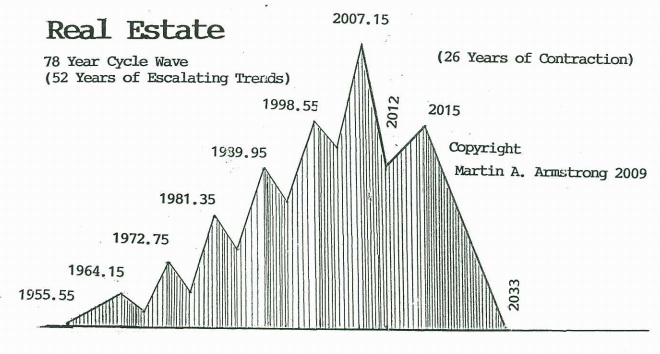
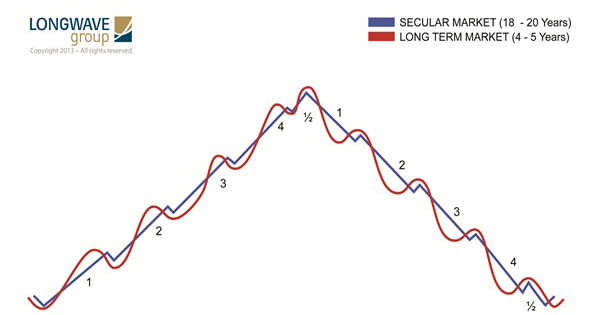
Which brings us to a third “cycle of interest’ for 2015. What else floats on a sea of debt? Real estate prices! This cycle was described before here:

As examples, due to his real estate cycle work for the US, he was telling clients–in the 1990’s to give them ample time to act–to be out of all US real estate investments by February, 2007; that real estate prices would then fall from 2007 into 2012, then rise into 2015 in a snapback rally that would sucker a lot of people back into real estate, and then fall again through 2033.

Well here we are in the snapback real estate rally into 2015. So many have forgotten the 9 million US foreclosures and the 7 million US households that are still “under water” on their mortgages. All the signs of a bubble are back, though now some are already starting to dissipate as real estate prices in some of the bubbliest areas roll over:

     Southern California home sale volume for January slowest since 2008: The stalemate accelerates with Orange County seeing a monthly median price drop of $28,500.

The bubble is stronger than ever in countries like Canada, Australia, and the UK. Unless people request it by sending me e-mails saying they want it, I’m not going to do a detailed post on real estate. I doubt it will change anyone’s mind, so it probably isn’t worth it. But when the biggest debt bubble the world–and perhaps the galaxy–has ever known pops, and governments are falling left and right, real estate prices will be hammered. And those falling governments will be desperately raising property taxes to try to stay afloat.

And anyone who agrees with people who say that “debt doesn’t matter,” like Dick Cheney from the right or Paul Krugman from the left, is going to get quite an education over the next few years. Actually, we all will. Which is good, in my view. Humanity badly needs to understand which actions have real value and which do not.

The deflationary wave intensifies

Little darling, I feel that ice is slowly melting
Little darling, it seems like years since it’s been clear
Here comes the sun, here comes the sun
And I say it’s all right
     –George Harrison, The Beatles, Here Comes the Sun

Most people have probably heard by now that world crude oil prices are in a dramatic plunge. In the futures market, the price is down 47% since June, from $107.68 per barrel to $57.49. The scuttlebut is that prices in the cash market are even lower as desperate countries and companies get what prices they can.

And it isn’t just crude oil prices that are crashing. Think stuff that China used for its “economic miracle,” like the price of iron ore (used in making steel), which has been cut in half since 2013.

But this current wave of deflation has taken on a new intensity. ZeroHedge summarized the most recent week quite well in Crude Carnage Contagion: Biggest Stock Bloodbath In 3 Years, Credit Crashes [my explanatory remarks in brackets]:

WTI’s [oil] 2nd worst week in over 3 years (down 10 of last 11 weeks)
Dow’s [stocks] worst worst week in 3 years
Financials [stocks] worst week in 2 months
Materials [stocks] worst week since Sept 2011
VIX’s Biggest week since Sept 2011 [VIX is a fear index, it rises when people are afraid]
Gold’s best week in 6 months [Gold is real money, solidified sunlight 🙂 ]
Silver’s last 2 weeks are best in 6 months [Silver is also real money!]
HY Credit’s worst 2 weeks since May 2012 [HY = High Yield (aka junk) bonds]
IG Credit’s worst week in 2 months [IG= Investment Grade bonds]
10Y Yield’s best week since June 2012 [10Y = US 10 year note]
US Oil Rig Count worst week in 2 years [Rigs are for drilling/fracking]
The USDollar’s worst week since July 2013
USDJPY’s worst week since June 2013 (USDJPY = US$ priced in Japanese Yen]
Portugal Bonds worst week since July 2011
Greek stocks worst week since 1987

So, why the intensifying deflation? Because, as has been explained here on several occasions, the world is groaning under an increasingly fierce debt load. The central banks have printed up $11 trillion in new money in the last 5 years to try to fend off deflation. Why? Because when debt loads get too large, some people and companies can’t pay back their loans, so they default, and the money they owe disappears. If they are companies, their employees lose their jobs. So their households spend less. Putting pressure on more businesses because of lost sales. Leading to more layoffs and more defaults. It’s a vicious cycle, an economy in reverse, and economy that is deflating. Remember, because all of the money in the system is debt, the economy must always grow to pay the interest on that debt. If the economy stops growing, the interest can’t be paid, defaults arise, and the deflationary cycle ensues. People tend to associate deflation with falling prices, but the falling prices are the result of deflation, not its cause.

So the central banks tried to ease the debt load by lowering interest rates to zero or lower. But one of the results was that all that cheap money financed all kinds of projects that would never have been created without this almost-free money because they weren’t very good ideas to begin with, such as the stories we’ve all heard about China having 3,000 companies all basically in the same business–how can they all make money? They can’t. Such overcapacity makes life tough for all of the companies, which all have to lower their prices, which start laying off employees, which can’t pay back their debts, etc. etc. as explained above. So this lowering of rates might seem to work for a short time, but when it’s carried on for years, it’s deflationary!

The second thing the central banks did was create this new $11 trillion to buy more debt! So they are trying to fight a problem of too much debt by creating more debt! Historians will marvel at the lack of logic by an entire academic profession. The reason for this pervasive illogic is that academic economists have for years purged from their ranks anyone who brought up the topic of gold as real money, ridiculing and marginalizing them. So they banished logic from their own ranks.

But let’s get back to the big deal of the last several weeks, the crash in oil prices. Cool, you might say, I’ll be able to pay less when I fill up my car with gas. True. But it might be wise to consider why oil prices are crashing:

     World Oil Demand Outlook Cut Again; Sub-$60 Price Seen Holding

Any hope that global demand would provide a floor for oil’s freefall was dashed as the leading energy forecaster cut its outlook for the fourth time in five months and crude extended its tumble.

Frankly, I don’t think I’ve ever heard of one of these international organizations like the International Energy Agency cutting their forecast four times in five months. So what’s happening is collapsing demand for oil.

Several recent financial statistics that measure changes in the economy are reporting levels of decline “last seen in 2009.” Recall that in 2009, a lot of people thought the world economy was not just staring into the abyss, but was about to fall in.

     PPI Slides, Misses Estimates, After Finished Goods Prices Tumble Most Since July 2009

     Short-Term Inflation Expectations Have Crashed To 5 Year Lows (In The US)

Now how does this relate to yet another “miracle” discovered by the pom-pom and short-skirt-bedecked economic and political cheerleaders, the “US shale miracle”? This is the miracle by which the US will allegedly frack its way to energy independence.

For the last three years, the US shale drillers have been borrowing $1.50 for every $1.00 in oil and gas that they pull from the ground. And that was with oil prices above $100 per barrel. The industry as a whole expected to get to breakeven–instead of losing money hand over fist, which is what they have been doing with oil just above $100–with oil above $120 per barrel. But now the price is under $60, which is less than half of the price needed for them to break even. (Chris Martenson’s group has done a great, clear video on this if you want the details.)

All told since early 2010, these energy producers have borrowed at least $550 billion. Remember that the size of the sub-prime mortgage problem was around $1.1 trillion, and the collapse of that sub-prime mortgage market nearly took down the whole system. These oil frackers have borrowed over a half trillion just since 2010 and now it looks like a lot of that borrowing will not get repaid, that is, they will default.

Now that $550 billion was a lot of spending for purchasing equipment and creating jobs to use that gear. It turns out that 1/3 of business capital spending in the US in recent years has been for energy exploration and production. And some estimate that 90% of new jobs created in the US in the last five years are related to energy production.

But now suddenly, no one wants to lend the frackers cheap money to create more overcapacity in the shale patch (because the lenders know there is a good chance they will never get paid back.) So now there will be a huge drop in equipment purchases and lots of job layoffs, leading to, you guessed it, more deflation!

If you don’t think this will happen, check this headline:

     Exclusive: New U.S. oil and gas well November permits tumble nearly 40 percent

Plunging oil prices sparked a drop of almost 40 percent in new well permits issued across the United States in November, in a sudden pause in the growth of the U.S. shale oil and gas boom that started around 2007.

Data provided exclusively to Reuters on Tuesday by industry data firm Drilling Info Inc showed 4,520 new well permits were approved last month, down from 7,227 in October.

So, the “US shale miracle” will be proven to be another fable, along with the US energy independence it was supposed to engender. It was fueled by a supply of ultra-cheap money that has now dried up. One aspect of fracked wells is that they lose 70% of their production capacity in two years, and 80% to 90% in three years. So to keep more oil flowing, these fracking companies have had to borrow more and more money to drill more and more wells. As described above, it wasn’t a very good business model and would not have existed were it not for the cheap money being provided to Wall St by the central banks.

So while you may be able to buy cheaper gas for your car, the US economy is likley to take a serious hit relating to jobs and business spending from the oil collapse.

And the US is supposed to be the bright spot in the world economy. Japan is in recession yet again. The Eurozone perennially flirts with recession, and is being dragged down by the US-led sanctions against Russia, which itself has fallen back into recession. China claims to still be growing, but the hard evidence of the falling prices mentioned above, falling real estate prices, and stalling growth in the use of electricity in China argues otherwise. From Deutsche Bank:

…the global financial system is still extremely fragile and not sustainable…2015 will be the 9th year of highly unconventional central bank policy and…we’re no nearer to finding a sustainable solution…
–Deutsche Bank

But not to worry: Uber, the emerging ride sharing service, is said to be valued at $40 billion. (Those must be some rides!)  And Jessica Alba’s new diaper-cleaning service company is apparently valued at $1 billion!

     No Bubble At All: Jessica Alba’s Diaper-Delivery Startup Is Valued At $1 Billion, Prepares For IPO

So I guess everyone will get rich (again, like in the year 2000) from internet startups?

Historically, deflation is rather unkind to stock prices. World stock markets are currently being floated by the free money from the central banks, but how long can that last? And this deflationary trend has supports beyond the overload of debt, such as the end of several cycles, including the the 26,000 year precession of the equinoxes, which tends to really clear the decks on this planet.

Now, will this deflation crash the price of gold? Not at all likely. Historically, gold increases in purchasing power during both inflationary and deflationary periods; these are periods during which people start to think that governments are losing control, so people opt for real money over government-issued scrip. Gold loses purchasing power when people think everything is, to put it technically, hunky-dory, and that their government is doing a great job. Most people don’t see it that way during bouts of deflation. Intelligent observers are still stacking real coins:

     Sales Of Silver American Eagles Rise To Record High For Second Consecutive Year

and likely hanging onto their hats to get ready for a very wild ride. Because sometimes, in reaction to deflation, governments really ramp up the money printing presses, and people lose all confidence in government money, which is known as hyper-inflation.

Whatever it is that’s coming, it’s good to know that our bank regulators will be well protected:

     Why Is The US Treasury Quietly Ordering “Surival Kits” For US Bankers?

The Department of Treasury is spending $200,000 on survival kits for all of its employees who oversee the federal banking system, according to a new solicitation. As FreeBeacon reports, survival kits will be delivered to every major bank in the United States and includes a solar blanket, food bar, water-purification tablets, and dust mask (among other things). The question, obviously, is just what do they know that the rest of us don’t?

War cycle update

Those who have been readers here for awhile: Are you now getting the flavor of how these cycles unfold? As a valid cycle comes into play, people fall into line and play their parts. The so-called “great men of history,” who conquered regions and nations: were they simply pawns falling into a role, pushed and prodded by cyclic forces far greater even than their Icaran ambitions?

Since the Wheeler Cycle of War and Political Change was last discussed here, full-blown wars have erupted in Ukraine, Gaza, and Iraq. Fighting has re-emerged in Libya. Tonight, we hear that the US will be bombing in Iraq. These wars join the continuing wars in central and North Africa. And the posturing and saber-rattling by China, Japan, Viet Nam, and especially the US and Russia, continue to build.

The graph of the Wheeler Cycle has been shown before, but some readers have told me they don’t much like graphs. So, in text: The Wheeler Cycle was discovered in the 1930s and was further enhanced by its current keeper, Martin Armstrong. The cycle is based on data from all cultures from 600BC to the present. It says that there is major war or major political change every 25.05 years, which is every 9,149 days. Please analyze the following:

Wheeler Cycle Date Major War or Political Change Event Start Date Commencing Event
7/26/1914 World War 1 6/28/1914 Archduke Franz Ferdinand assassinated
    7/28/1914 War declared
8/13/1939 World War 2 9/1/1939 Germany invades Poland
8/30/1964 Viet Nam War 8/2/1964 First alleged Gulf of Tonkin attack
    8/4/1964 US bombs North Viet Nam
9/17/1989 Fall of Communism 11/9/1989 Fall of the Berlin Wall
10/5/2014 ???? ????

A careful reading of the above and a recall of the history of these events show that the forces for war and political change build and build as the cycle date approaches and then, within a month in either direction of the cycle date, an event occurs that is understood, either at the time of the event or later, as the start of a major world change.

So, we approach the center of the cycle on October 5, 2014. Regrettably, we see the forces of war building.

The worst part of this is: major wars begin around the cycle date, but the fighting generally builds to its greatest intensity four to six years after the start date. Think of the wars in the table above and this becomes clear.

Perhaps now you can see why I have been focused on the fact that people must now resist war. If this cycle is allowed to express itself without mass resistance from humanity, the default is horrendous. And this is up to people. Our “leaders” are leading us to war.

The current situation is exacerbated by the presence of another cycle pointed out by Armstrong: we are again approaching the focal point of the cycle of internal political unrest and revolution. One can see this playing out in Tunisia, Egypt, Thailand, Myanmar. One can see it in the internal politics of nations, where the dominant political parties are beginning to face formidable upstarts, and where, worldwide, more than 550 separatist groups are seeking freedom from what they consider to be tyranny.

And regarding the “great men of history,” I do look forward to a time when history is not the study of the Caesars, Napoleon, and Hitler, but rather the study of how Patanjali and Plato and da Vinci and Shakespeare and Blavastky and Aung San Suu Kyi and the Buddha and Jesus and many others shined the light of evolution, showing people new ways to comprehend, to express, to relate.

And I look forward to the study of history including the study of cycles, so that we are not their unwitting slaves.

And I look forward to the Wheeler Cycle being simply called the Cycle of Political Change as war is studied only as part of the archaic and primitive phase of human evolution.

A brief comment on the metals

This is strictly an opinion piece, I will not try to prove my case with links, charts, and so forth. An attempt to prove the case would be seriously lengthy, a project for which I don’t currently have the time and which I doubt most would want to read.

There is a very bright golden light on the horizon for precious metal prices, but that light is on the horizon (let’s say the first half of August), not right here. In other words, I think prices will drop first before they start rising in a serious way. I see four separate price, time, and trend patterns that include an expectation that price falls first before it takes off to the upside in a big way. And these patterns are supported by the seasonal pattern for gold which shows prices typically falling in the Summer and then turning up sometime in August.

So for anyone who has savings to deploy in the metals, the setup is ideal: you should get lower prices over the next couple of months for your buying, with an expectation that your buying will be followed by the start of a major price rally, that is, the prices available over the next several weeks should be quite a bargain.

For those of you who bought your metals years back–hopefully at prices that are still well below where they are now–and who have no additional buying power, you’ll need to be patient here, but as implied above, a price drop dead ahead will be an elegant completion of major recognizable patterns (based on four entirely different types of calculations) that have an exceedingly high probability of being the end of this general price downmove that started in late 2011. These patterns all clearly indicate that the bull market in metals that started early in this century still has many years to run, and that the best upward price movement is definitely still ahead of us.

Of course this could all be wrong if some huge war breaks out, in which case prices could go up and never look back. But if things are allowed to work out with “only” the normal amount of accelerating instability that is the most important trend of our time, then these reliable price, time, and trend patterns are likely to complete as outlined above. In any case, no matter what, prices should turn up for good later in the Summer.

This post is an attempt to keep emotions out of the precious metals picture so that as many of us as possible own some when we will all truly need them down the road. (I am serious about the word need; my repeated posting about gold and silver has nothing to do with an “investment scheme” to get rich quick or with having the “right asset class in your diversified portfolio,” I am talking about what people will soon need.) As their propaganda on this topic and their dirty tricks clearly show, the Powers That Were want you to get emotional and make the mistake of avoiding or selling physical metals so that they can accumulate more metals for themselves at low prices. I’m hoping that everyone who reads Thundering Heard is well prepared to fend off, or even capitalize on, their tricks.


What’s up with the metals? Part 1

First, a digression right off the bat: let me say that I hope everyone who is interested in the precious metals is doing their own research on this topic so that they can make truly informed decisions, especially since I am not a registered financial advisor of any type, these are just my views of the world. One of the best ways I know to become informed on the metals is to get the free e-mails issued by GATA, the Gold AntiTrust Action Committee. You can sign up for their e-mails here. They send out links daily pointing to the best articles about gold and related topics from across the web. OK, end of digression.

*  *  *

Since I was wrong last Spring about when gold would make its next move up, let’s look at the views of three very capable market commentators who were correctly bearish on the gold price during 2013, that is, they thought that the price would drop. They were right, and perhaps their analytical work will continue being right. So let’s look at what they are saying now, and throw in the opinion of the head of the largest gold refinery in Switzerland as well.

Tom DeMark

The first analyst is Tom DeMark. Tom has been a trading advisor to the big institutions for decades. It’s rare for him to give his advice in advance to us commoners, though in his defense, he has published many of his techniques for those who wish to spend the time to learn them.

What DeMark said on December 16, 2013 about the metals is in the last minute of the short interview at this link. He said:

We’re looking for a huge move in gold next year, beginning next year. We think the bottom will occur with the tax loss selling this year.

So what he is saying is that, as soon as those who want to take trading losses on their gold positions for tax purposes (to balance off other gains they had) finish that activity, then price will begin that “huge move” up that his firm is expecting. His price projection, for a long time, for the downside in the gold price had been $1180. In the interview, he said they had revised that to somewhere between $1155 and $1180. The price went down to $1181.40 on the last day of 2013, the last possible day for tax loss selling for the 2013 tax year. That’s probably plenty good for meeting his price target, but we’d have to be institutional clients of DeMark to know whether he now thinks price might still move down to $1155. In any case, by DeMark’s famous work, the price low is already behind us or will be here very soon. There will be evidence below that JP Morgan may have been following DeMark’s advice precisely.

William Kaye

The second fellow who was right about the gold price dropping in 2013 is veteran money manager and former Goldman Sachs employee, William Kaye. Kaye repeatedly gave interviews in 2013 on King World News where he would point out movements of physical gold in the markets that indicated the next phase of price manipulation down by the Fed and the big banks would happen promptly. And it would unfold as he predicted. In this December 31, 2013 interview, Kaye said he thought the gold price could be manipulated down one more time in January, followed by a large, fast move up for the gold price to somewhere between $2,000 and $2,500 in 2014:

My guess is we are now looking at mid-to-late January of 2014 as a probable and absolute bottom, after which it is going to be difficult for sidelined investors to gain a position because gold and silver will then move very, very quickly in the other direction.  That is why most people are going to miss this move…

While all of the Western media is filled with anti-gold stories, China continues to buy virtually all of the available physical gold at these levels, and will continue to do so on any further price declines.  Also, the flow of gold into India has continued because of increased smuggling.  But none of the smuggled gold is being reported in the official import numbers.

One of the primary reasons this gold flowing into India is not being reported is because the politicians themselves control the smuggling rings.  The reason India has such a large current account deficit and a loss of confidence in the Indian currency is because of the bad government policies.  The people of India see this and so they seek refuge, as they always have throughout history, in gold…

As you know, Eric, I have extremely good sources and contacts in India because we’ve done business there for years. If our sources are correct, this year the gold imports into India are very close to 1,200 tons, which is a staggering figure.

On top of that, we have the Chinese importing a mind-boggling 2,200 tons of gold for 2013. That figure actually totals the entire global mine supply for all of 2013 outside of China…

You also have to remember that we have enormous demand from other countries around the world such as Russia, Brazil, just to name two…

Regardless, 2014 is going to be an extremely good year for the precious metals.  I believe we could easily see new highs in nominal terms in both gold and silver.  We may see $2,000 to $2,500 in gold, and $50 to $60 in silver, maybe even higher.  The bottom line is that 2014 will be the year that the cartel gets broken.

Martin Armstrong

Our third commentator is Martin Armstrong. The guy has done some of the best financial cycles work in modern history. As examples, due to his real estate cycle work for the US, he was telling clients–in the 1990’s to give them ample time to act–to be out of all US real estate investments by February, 2007; that real estate prices would then fall from 2007 into 2012, then rise into 2015 in a snapback rally that would sucker a lot of people back into real estate, and then fall again through 2033. (Yes, real estate folks, you read that right, a 26 year bear market in real estate that started in 2007.) A summary of that work published in 2009 is here, and a look at the chart from the first page tells the story very well:

ArmstrongRealEstate

To say that this was good advice, at least so far, would be quite an understatement. Also in the 1990’s, he told his clients that interest rates/mortgage rates would fall till January 2013 and then start an inexorable rise for many years to come. He was only off by six months, interest rates went to their lowest level in mid-2012 and have been generally rising since.

So the guy is very smart. But I don’t have a link to his site on the Thundering Heard home page because it is nearly unbearable to read him daily. Anyone else’s views on anything, he calls those opinions, and pelts them with ridicule and insults if they disagree with his own opinions, which he claims are not opinions, but actual facts.  His cycles work is fabulous, his knowledge of history is formidable, but when he strays from those, as he often does, you have to put your boots on and wade through it. That’s a worthwhile exercise, but you have been warned.

Anyway, Armstrong is our third analyst who was bearish on gold all year, to the point where he called anyone advising buying gold during 2013 to be a fool, criminal, and worse. But all year, he has expected a Directional Change (his capitalization) for gold in this month of January, 2014.

So with DeMark, Kaye, and Armstrong, you have three very capable analysts who think this price downmove is over, or will be in over in this month of January. If I were a person with savings denominated in fiat currency, I would be jumping all over this opportunity. But of course, people need to make their own decisions. As mentioned above, getting the free e-mails from GATA is a great place to start. And no, they don’t sell your e-mail address to others.

So what does the head of the largest Swiss gold refinery have to say about all this?

     Alex Stanczyk: Physical Supply Never Been Tighter

I’ll let the article speak for itself:

Refineries in Switzerland are still working 24 hours a day to cast bars for China, sometimes having difficulties sourcing the gold…

We met with the managing director of the largest refinery in Switzerland and spend about two hours talking to him…Now, this gentleman we were talking to probably has a better idea of physical gold flow than anybody else globally. He sees what is coming from the mines, he sees what is coming from the UK, and all over the world, as well as where its going. He indicated the price didn’t make sense because he has got so much fabrication demand. They put on three shifts, they’re working 24 hours a day, and originally he thought that would wind down at some point. Well, they’ve been doing it all year. Every time he thinks its going to slow down, he gets more orders, more orders, more orders. They have expanded the plant to where it almost doubles their capacity. 70% of their kilobar fabrication is going to China, at apace of 10 tons a week. That’s from one refinery, now remember there are 4 of these big ones [refineries] in Switzerland.

…At this Swiss refinery there have been several times this year on which they were unable to source gold, this shocked me. They’re bringing in good delivery bars, scrap and dore from the mines, basically all they can get their hands on. This gentleman has been in the business for 37 years, he was there during the last bull market in the late seventies. I asked him when was the last time this has happened, that he was unable to source gold, he said never. And I clarified it, I asked: let me make sure if I understand what you’re saying to me, in the last 37 years you’ve worked in the gold industry this has never happened? He said: this has never happened.

When do think the price is going to rise?

“I’m not comfortable to put a time on this. What I do know is that we are on the threshold of a situation that has never occurred before. A squeeze is imminent, it could take 3 months or 6 months, but all I know is that it’s coming, and I know that with 100% certainty.”

What Stanczyk is talking about is shown on the next chart, which has only been updated through the end of October. Hong Kong has imported more gold from Switzerland in 2013 than in all prior years combined!

HK-Swiss-gold-trade-10-2013

(Chart source: China Mainland Gold Import Accelerating )

Here’s a way to look at the overall Chinese gold imports from Hong Kong:

Gold_HK_to_China_2011_2012_2013

(Chart source: China Imports More Gold Via HK In 2013 Than 2011 & 2012 Combined)

And here is a chart of total Chinese imports from Hong Kong by month since Autumn 2011. And this chart doesn’t show imports from other sources or China’s own mine production, which is now the largest of all countries and which is keeping six large refineries busy in China. There have been reports (blatant lies is what they are) in the Western media that Chinese gold imports have been falling. Does this look like falling to you? Each of those numbers are tons.

China Gold Imports to October 2013 Gross

(Chart source: China October Gold Imports Surge To Second Highest Ever)

Despite strong government disincentives to buying gold in India, as we heard from Kaye above, the flow of gold can’t be stopped. Here’s a typical story:

     Smugglers smile as NRI carriers bring gold into country legally

It was evident last week when almost every passenger on a flight from Dubai to Calicut was found carrying 1kg (2.2 pounds) of gold…

This strong buying is a worldwide story:

     Scarcity of Gold in Mexico

Including Canada, Australia, and the US, as reported here by the Wall Street Journal:

Sales of gold coins are booming even as the metal’s price is falling…at mints and coin shops around the world, gold continued flying off the shelves…

Sales of Gold Maple Leaf coins by the Royal Canadian Mint surged 82.5% to 876,000 ounces in the first three quarters of 2013 from the same period of 2012. The Perth Mint, Australia’s national coin and bar producer, saw sales rise 41% to 754,635 ounces last year, while the U.S. Mint sold 14% more American Eagle gold coins than it did in 2012, along with a record amount of silver coin.

Even JP Morgan, big sellers of their own horde of physical gold earlier, which helped to drive prices lower, has been rebuilding their cache, perhaps guided by Tom DeMark’s work, or perhaps to simply be the manipulating elephant that they have been caught being in so many other markets:

     JPM’s Quiet Scramble To Refill Its Gold Vault

JPM Eligible

In Part 2, we’ll talk about how it is possible to have extraordinary worldwide demand for physical gold and still have a falling price.

War cycle influences

They admit to financing terrorism and they get fined $32,000. Where if I were to do that, I would go to jail for life. –Everett Stern, a former HSBC compliance officer on the fine levied on HSBC for funneling hundreds of millions of dollars to Hezbollah

Scientists tell us that when cycles pull in opposite directions, they can nullify one another. They call it wave cancellation:

wavecancellation

But when cycles push in the same direction, the effects are amplified. A storm surge is one example: As they blow across the ocean’s surface, the winds that create waves accelerate during a storm, causing the cycle of ocean waves to have far greater wave heights. These waves combine with the high tide waters of the tidal cycle, and a storm surge ensues with sometimes devastating results, such as the damage at Tacloban from Typhoon Haiyan:

TaclobanBA2

The so-called Great Recession is another example: Thundering Heard talked about two cycles–the highly reliable 25-year recession/depression cycle for the USA described in What is the Transition? Conclusion; and the cycle of Pluto moving from Sagittarius into Capricorn described in A Forecast for the Next Eleven Years, still in effect through 2024–that combined to make the financial crisis of 2008 very deep and long-lasting, with many saying that these cycles started a depression that is still going on today. There are other cycles, even larger ones, that contributed to the Great Recession/depression, but I haven’t yet had time to explain those, though I plan to soon.

Does the existence of a cycle mean that something must happen? In human affairs, no, often because larger cycles can mute or nullify smaller cycles, represented in this graph, showing that the cycle represented in red might be nearly unnoticeable at times because of the dominant cycle in blue:

LongerShorterCycleSuperimposedcr

However, when larger and smaller cycles point in the same direction, the results can be awe-inspiring. We have such a situation now relating to war. I know of at least five cycles pointing in the direction of war. Two have been discussed before.

One is the Wheeler Index of War and Political Change, discussed here and here, whose troughs have coincided with great precision with the starts of World War 1, World War 2, the War in Viet Nam, and the massive political changes that transformed Russia and China in 1989. The next trough in that cycle is due in 2014.

Another cycle pointing to war in the 2014-2016 period was discussed here.

Again, I know of other cycles that point to major war in the near term, but even if I documented those to the hilt, would it convince us all that that major war must happen? Probably not. But clearly, the influence of these cycles is being strongly felt. Over the last couple of decades, the talk of war has primarily been talk of smaller regional wars. But recently, talk of superpower war has been ramping up.

Here’s one from the Yale Journal of International Affairs, not exactly some emotion-laden incendiary blog, about war between the US and China:

     Who Authorized Preparations for War with China?

The Pentagon has concluded that the time has come to prepare for war with China, and in a manner well beyond crafting the sort of contingency plans that are expected for wide a range of possible confrontations.

     Russia will use nukes in case of a strike – official

     Russia Stations Tactical, Nuclear-Capable Missiles Along Polish Border

     China Declares “Willing To Engage In A Protracted Confrontation” With Japan As “Prime Target”

     US Challenges China, Flies B-52 Bombers Over New Air Defense Zone

     Japan Dispatches F-15s, E-767s And P-3 Into China’s Air Defense Zone, China Scrambles Su-30 In Response

     China Re-Escalates, Deploys Warplanes To Air Defense Zone

     China Slams Abe’s “Malicious Slander”; Warns Japan Is “Doomed To Failure”

     First Glimpse Of China’s Nuclear Submarine Fleet

     US, Chinese Warships “Nearly Collide” In South China Sea

Hold on: how can two massive ships, visible to the naked eye and certainly to radar from hundreds of miles away, “nearly collide”?

     South Korea Unveils It’s Own Air Defense Zone, Overlapping China’s And Japan’s

     Japan Press: “China-Japan War To Break Out In January”

     Japan to bolster military, boost Asia ties to counter China

Japan will boost its military spending in coming years, buying early-warning planes, beach-assault vehicles and troop-carrying aircraft, while seeking closer ties with Asian partners to counter a more militarily assertive China…

Abe’s government also vows to review Japan’s ban on weapons exports, a move that could reinvigorate struggling defense contractors like Mitsubishi Heavy Industries Ltd and Kawasaki Heavy Industries Ltd.

     Is War With China Inevitable?

And of course, the Middle East doesn’t want to be left out of the headlines:

     Israeli Generals Preparing For “Short, Sharp” War Against Hezbollah

     US Drones Taliban Leader; His Troops Vow Bloody Revenge; Pakistan Government Furious At America

     Syrian Army Base Rocked Again By Overnight Explosions, Israel Implicated

     Regional War Scenario. NATO-US-Turkey War Games Off the Syrian Coastline

The Saudis and Israelis are seething that the US and Europe are negotiating with Tehran. Perhaps that is why the role the Saudis played in helping to set up the 9/11 attacks is beginning to get some airplay?

     Inside the Saudi 9/11 coverup

However, I don’t think they need to seethe, a quick look at these Iran negotiations says there is something more than fishy about it. First, there were meetings and it looked like there was an agreement, but at the last minute, the US insisted on lots of changes. This happened when some of the negotiating teams were already at the airport on the assumption that an agreement had been reached. So that first agreement was scuttled.

The parties met again a few weeks later and announced an agreement which was really an agreement to come together again to negotiate the real details. The parties each went back to their countries saying they got what they wanted, despite the fact that these claims were contradictory, as documented here by CNN:

     Iran nuclear deal: One agreement, wildly different reactions

     Iran’s Rouhani: “We Are Not Dismantling Our Nuclear Facilities; Iran Will Maintain Its Uranium Enrichment Programme”

One thing that was clearly promised to the Iranians was no new sanctions. As soon as the detailed negotiations got started, the US broke that promise:

     Iran Quits Nuclear Talks After US Expands Blacklist Sanctions

Iran has quit nuclear talks with world powers, accusing Washington on Friday of going against the spirit of a landmark agreement reached last month by expanding its sanctions blacklist.

Last I heard, Iran is back at the table. I’m happy to hear that. But given the antics of all of the parties, I’m not especially optimistic about the outcome of these talks. They sound like the endless US budget talks where agreements are reached to maintain the status quo and do the real negotiations later.

And the Europeans look like they want to play their part in adding to the warmongering tone:

     Facing Triple-Dip Recession, France Set To Deploy US-Made Drones In West Africa

It appears that the more oil and gold they find in West Africa, the more troops keep showing up.

All of the above shows why it is very helpful to know which human affairs cycles are ending and which are gearing up: knowing the influences that are pressuring people, behaviors start to make more sense. Not rational sense: no one could possibly claim it is rational for Japan and China to be threatening war over rights to small, uninhabited islands. But behavioral sense: one can see how the players are playing their parts. Probably unconsciously, since most people, unfortunately, consider cycles analysis to be some kind of voodoo. Of course, anyone who knows what cycles are in play can be conscious about them, sidestepping negative influences, and hopping on board positive trends, some of which were mentioned here.

But at least we can rest assured that warmongering will be starved for financing: US Government regulators fined big bank HSBC for allowing “hundreds of millions of dollars” to be transferred to Hezbollah. The fine? $32,000. I guess HSBC had to dig real deep into their petty cash drawer to pay that one. The regulators said HSBC, the bank recently fined $1.9 billion for facilitating money transfers for the drug cartels, came to them voluntarily with this violation of international rules, so the regulators probably sat around and said, “Oh, isn’t that sweet, HSBC is so honest, such nice people, we can’t be mean to them.”

     HSBC Gets Slap On The Wrist For Helping To Finance Terrorists

A major U.S. bank has agreed to a settlement for transferring funds on the behalf of financiers for the militant group Hezbollah, the Treasury Department announced on Tuesday.

Concluding that HSBC’s actions “were not the result of willful or reckless conduct,” Treasury’s Office of Foreign Assets Control accepted a $32,400 settlement from the bank. Treasury noted, as did HSBC in a statement to HuffPost, that the violations were voluntarily reported.

Everett Stern, a former HSBC compliance officer who complained to his supervisors about the Hezbollah-linked transactions, told HuffPost he was “ecstatic and depressed at the same time.”

“Those are my transactions, I reported them,” he said, satisfied that the government was taking action. But, he added, “Where I am upset was those were a handful of transactions, and I saw hundreds of millions of dollars” being transferred.

Stern said he hopes the government’s enforcement actions against HSBC have not come to an end with the latest settlement. “They admit to financing terrorism and they get fined $32,000. Where if I were to do that, I would go to jail for life,” he said.

We sure all know what Hezbollah plans to do with those hundreds of millions–add to their existing arsenal that already includes 80,000 to 100,000 rockets and missiles. No wonder the Israeli generals are in a panic to act soon, which of course falls right in line with the timing of the war cycles. But I do wonder who Hezbollah will be buying their new weapons from, that is, who will be the real recipients of that money.  As usual, the Dark Forces want to make some big bucks off the carnage of war they are fomenting–right in line with the cycles.

A Cycle that Says “Get Ready”

There haven’t been many posts here lately, in part because it looks to me like we are on the precipice of major changes. So I’ve been spending some time finalizing my own preparations in terms of food (backup supplies and the infrastructure for growing more), electricity, water, and so forth. (Hint, hint.) Many think (hope?) that The Powers That Were can keep this all going for years. With the clear acceleration of infighting among the elites, to me that seems like a very bad bet.

So I found this post from Deflation Land to be interesting in terms of us being right on the cusp of major changes:

     Why I stopped worrying and learned to love the currency collapse

“For the past 300 years, the historical pattern has been for the era marked by a century to continue into the following century by fourteen or fifteen years.

“Let me explain. Everyone knows that the 19th Century, its uprightness, its optimism and sense of purpose, the halcyon days of British Empire, came to an end with World War I, starting in 1914 and building to a nasty crescendo by 1916. The 20th Century had arrived, and it had some real horrors in store for us.

“But if we return back another hundred years, we notice that the 18th Century ends in 1815 with the final defeat of Napoleon, that final project of the Enlightenment and of the French Revolution.  With the Congress of Vienna in 1814-1815, we have a new Europe along the lines of Metternich’s plan, and the 19th Century at last is here.

“In 1713 and 1714, we have the Treaties of Utrecht, Baden, and Rastatt, bringing an end to the era of Spain as a major power, and the rise of the Habsburgs.  Louis XIV dies in 1715, after reigning for 72 years.  The Baroque period is over, and we are now firmly in the 18th Century.

“We still live in the 20th Century…We still live in an era of Pax Americana, the old republic very much a strained and tired Empire now, with the U.S. Dollar as the world’s reserve currency.

“That is going to change.

“The next task for History is to dismantle the untenable structures and institutions put in place by late Modernity, which have been extended now as far as they can go. Our debt-based monetary system will collapse, our unbacked fiats will be worthless. The debts and unmeetable obligations will all default.

“There are ironies and great contradictions as the former home and hope of Liberty becomes viciously unfree and increasingly despotic. Our leaders no longer govern, but try instead to rule us — they are less legitimate with each passing day, their laws corrupt or worse. They are nearly finished, and will be swept away with the tide.

“Just as in 1914, the internationalist system will break down, dashing the hopes of the would-be first-world nations. We will probably have a pretty good war as well, or many local ones worldwide. These transitions tend to involve war.”

*  *  *  *  *

Combine the above with the Wheeler War Cycle and other war cycles discussed here, and it looks like our current faux stability–in which the gears of government and the economy grind on and on with little progress in any direction–will, within months, be a memory. The full Deflation Land article is here.

War

Despite a rare display of intelligence shown by a group of politicians, with the British parliament rejecting their Prime Minister’s call for war, at least for now; and despite serious questions raised by the likes of a former NPR reporter with years of on-the-ground experience in the Middle East who states that eyewitnesses say it is the Saudis who supplied the chemical weapons to the rebel forces; it seems almost certain that the US will be waging war in Syria, likely beginning with attacks launched from US naval vessels.

Most people might think this will be another “Libya” type of war with US techno-hardware pummeling the country for a couple of months and then it will be over. A bunch of political posing and sniping. Lots of discussion about whether annihilating people is legal! Little or no direct inconvenience to anyone in the US or Europe. And little consideration of the reality of those who will hold someone they love in their arms and experience the agony of seeing their beautiful friend demolished.

Why is this war less likely to be a brief campaign and more likely lead to World War 3?

1. There are 30,000 Russians living in Syria. If some of these people are killed, do you think Russia will just say, “Oh well. No problem.”

2. Russia is a long-time ally of Syria. They have a naval base there. They sell lots of arms to Syria. If Assad is toppled, Russia loses big strategically and economically: they wil likely lose their naval base; they lose a good arms customer; but most importantly, a new regime might be quite happy to allow the Qatari’s to build a natural gas pipeline across Syria to supply Europe with natural gas, breaking the Russian monopoly on the European natgas market.

3. Iran is an ally of Syria. Both countries are well aware that they are on the list of countries  whose governments the US planned to topple as early as 2001, as reported in this required-listening two minute video interview with General Wesley Clark:

So I came back to see him a few weeks later, and by that time we were bombing in Afghanistan. I said, “Are we still going to war with Iraq?” And he said, “Oh, it’s worse than that.” He reached over on his desk. He picked up a piece of paper. And he said, “I just got this down from upstairs” — meaning the Secretary of Defense’s office — “today.” And he said, “This is a memo that describes how we’re going to take out seven countries in five years, starting with Iraq, and then Syria, Lebanon, Libya, Somalia, Sudan and, finishing off, Iran.”

And Iran is an ally of China.

4. Cycles: Manfred Zimmel, whose excellent forecasting work we have discussed here and here, has for many years been predicting that the period from 2013 to 2018 will be “the War Years.”

5. Cycles: The uncanny Wheeler Cycle of War and Political Change, discussed here, arrives again at its most intense point for the risk of major war in 2014:

WheelerCycle

6. Cycles: Michael Mau’s books predicted world war for this period unless humanity can stand up to being manipulated into war yet again. Mau’s books contain detailed discussions regarding who manipulates politicians and populations into war. So this is a big test for humanity: do people want war or have they truly had enough of it?

7. Cycles: August 2013 was given here as a major potential economic turning point. Oftentimes, people and nations play their part when a big cycle is ready to turn.

8. The US badly needs a distraction from the revelations of illegal spying that arrive almost daily.

9. The US badly needs distraction from its financial failures and its upcoming battle over the debt ceiling. Even researchers from within the US Federal Reserve have admitted that the Fed’s money printing has had little positive effect, and they have announced that they would like to gradually stop printing so much. (Perhaps the White House will basically force them to keep printing to support a war?) And even that gold-bashing defender of the status quo, the Financial Times, began an article with this quote:

The world is doomed to an endless cycle of bubble, financial crisis and currency collapse.

And included this sentence in the same article:

A stable international financial system has eluded the world since the end of the gold standard.

(Side note: Numbers 8 and 9 are partial indications that things have not been going so well for the US lately. This too is a result of a specific cyclic influence, so if you are confident that a US war foray will be quick and successful, you might wish to contemplate what the news flow has looked like for the US for the last several months.)

10. There are always those powerful groups who stand to profit greatly, financially and politically, from war, as described so well by US Marine Corp hero General Smedley Butler in his booklet War Is A Racket.

So what’s it going to be, folks? Have we had enough of war? Or do too many still want war, or not care one way or the other? Whatever the numbers, it seems that humanity still does not understand that the advice “Do unto others as you would have them do unto you,” contains the idea that what you do to others you are doing to yourself. Humanity is one, though it appears that few are aware of their awareness that such is the case.

If you have chosen to have preparations in place for when it really hits the fan, and if you have not completed those plans, my suggestion would be that you wrap them up now. Not in a state of fear, not in a panic, but with definite persistence and logic. Perhaps the status quo in this world can hold on till 2014, or even 2015. But betting that way entails some serious risks. Besides, preparing for a life independent of the theftocracy–that is, working with gardens, greenhouses, plug-in vehicles, solar arrays, water wells, and so forth–is a lot of fun.

More cycles

Yet another instance of the accelerating flood cycle: a photo from the devastating Himalayan floods, indicating a stance people might wish to take during these times:

submerged-lord-shiva-idol-in-rishikesh-1

* * *

Despite being surrounded by the cyclic nature of physical life (breathing, heartbeat, blinking, day/night, tides, seasons, birth/death … and the less visible or invisible: sound waves, radio waves, x-rays, microwave cooking, evolution … and for a fun contemplation of large astronomical cycles, see this and this), for the most part, people tend to ignore cyclicality in favor of seeing life as a straight-line progression. This is unfortunate for at least two reasons: first, because all form is cyclic—form emerges, flourishes to some extent, and dissolves; second, because there are some not-so-obvious cycles that offer understanding for what is otherwise quite mysterious. In fact, here at Thundering Heard, we are on a path to discuss the biggest cycle of them all for people, a cycle that, once grasped, contains the answers to “little” questions like the meaning of life, why are we here, and so forth. But first, let’s get more adept at seeing the cyclic aspect of life and how important it is.

The Sunspot Cycle

There is a peak of sunspot activity every 10 to 13 years, with 11 years being the average for each cycle. A chart of the peaks and troughs of sunspot activity from 1926 to 2009 looks like this:

Sunspots_Longer_Annot3

Let’s look at the three peaks labeled A, B, and C.

The peaks of sunspot activity often really “rev people up” financially, that is, there is typically an excitation of human activity that leads to a financial market bubble that coincides with the sunspot peak.

Three peaks ago, the peak in 1980, labeled A above, coincided with the peak of the commodity price boom and price inflation that took place in the 1970s after Nixon defaulted on the US promise, made near the end of World War 2, to always support conversion of Dollars into gold. Those were the days when the so-called Misery Index (inflation plus the unemployment rate) was tracked in daily newspapers, and mortgage rates in the US rose to 18%.

Here’s a closer look at the last two peaks of sunspot cycle activity:

Sunspots_2_Annot

The cycle peak labeled B was in 1990 and corresponded with the peak in Japan of bubbles in their stock and real estate markets. This was the time when it was generally held that Japan Inc. would rule the world, or at least own it; that its economy would soon be the largest in the world. A single block of downtown Tokyo real estate was said to be worth more than all of the real estate in California. Now that’s a bubble! (We’ll see in our next post on cycles why that Japan bubble grew so large when we cover another cycle that also contributed to this Japan peak. When multiple important cycles converge, the results can be gargantuan.) Following that peak, Japan experienced what has come to be called The Lost Decade, though it has now run for two decades. Both their stock and real estate markets lost 75% of their “value” after that peak, and they still have not come anywhere close to recovering their former glory as Japan has been mired in nearly constant recession ever since.

The sunspot peak labeled C aligned with the peak in the internet/technology stocks in the Spring and Summer of 2000, another famous bubble. Again money flowed, this time into Pets.com, Webvan,com, Geocities,com, DrKoop.com, and many others, most of which had little going for them except an idea and a web site. Little or no sales, no profits—who cared! They were going to the moon. It was a New Paradigm. If you thought it was insane, you “just didn’t get it.” And the thing is, that craziness for internet stocks had been in play for a few years; that hoopla could have ended in 1998 or 1999. But it didn’t. It ended when the sunspot cycle peaked in 2000.

Looking back, it would have been great for the participants in those bubbles to be aware of the sunspot cycle peak. They could have sidestepped a lot of trouble. So what’s going to happen this time around? Well, for a few years, I have thought that  this economic cycle might hang on into the peak of the current sunspot cycle, called Solar Cycle 24, which was projected for August 2013. But Amon Ra may have thrown us a curve ball. It looks like this cycle will not have the usual single large peak, but rather a dual peak like Solar Cycle 14 from the early 20th Century. According to solar physicist Dean Pesnell of NASA’s Goddard Space Flight Center:

“This is solar maximum. But it looks different from what we expected because it is double peaked.” Pesnell noted similarities between the current cycle and Solar Cycle 14, which happened between February 1902 and August 1913 and experienced a double peak. If the two cycles are in fact twins, he said that “it would mean one peak in late 2013 and another in 2015.”

Here is a chart that shows the peak in 2000 plus our current cycle:

sunspts_predict_l

If the NASA guy is right, there should be a bubble peak in either 2013 or 2015. But a bubble in what? Here are some clues:

  • Lots of savings accounts pay only 0.01% in interest.
  • Mortgage rates got near 1% in Japan and 3% in the US. (Would you lend money to a stranger for 30 years for 3% interest? Neither would banks, which is why almost all mortgages need a guarantee from a government program or the banks won’t make the loan.)
  • Short-term interest rates in Germany and Switzerland recently went negative. That’s right, if you wanted to lend money to Germany or Switzerland on a short term basis, you had the pay them for the privilege.

If you think these phenomena don’t make a lot of sense, you are right. But it points to the culprit that has all the hallmarks of a monster bubble: the world government bond market. The bull market in bonds has been running for over 30 years. On May 2, if you wanted to lend money to Germany for 10 years, they would pay you an interest rate of 1.2%; the US, 1.6%. And if you wanted to lend Switzerland money for 10 years in December, they were paying a whopping 0.4%. Japan? 0.45%.

And in the case of Japan in particular, they are working very hard to devalue their currency, to make sure the yen falls in value. So the question is, who in their right mind would lend to these countries for such a pittance in interest, especially while most of them are printing money to intentionally debase the value of their currencies!?! You get a very poor interest rate and, if you get your capital back, it will be in a currency that will have fallen in value over 10 years. Yet, that is what institutions and people are doing. Recently, if you wanted to get a reasonable interest rate on 10-year government bonds, then you would have lend money to the country of Rwanda; they paid 7% on a recent offering of 10 year bonds. Best of luck getting your capital back 10 years from now.

When this bubble bursts, the consequences will be huge. This is not a bubble in one country, like Japan in 1980, or in one sector of the economy, like tech stocks in 2000, we’re talking about government bonds, worldwide! This is the market that supports military spending, education, transportation, and just about every safety net (in the US: Social Security, Medicare, Food Stamps, Medicaid, Unemployment Insurance, and so forth) on the planet. And you get this paltry interest rate when you might not even get your capital back in 10 years. A number of governments are on a clear trajectory for bankruptcy; there is a good chance that bond buyers will not get their capital back! And yet they lend huge amounts of money to these governments. Especially Baby Boomers, they have been pouring money into bond funds. Just like they poured money into stocks in 2000, and real estate investments in 2006. Oh well.

When do I think the bond bubble will pop? This year! 2013. I don’t think it can last to 2015. In fact, the bubble pop may have already started. And guess which institutions count government bonds as their major “stable” capital: banks. Yet another reason to watch out for the banks!

Furthermore, the solar cycle might actually peak this year. The NASA guy might be wrong about the dual-peak forecast.

What will it mean if this bubble pops? It means interest rates will rise, possibly a lot. This will strongly increase the amount of interest governments must pay on their debts. Their deficits will skyrocket.

Mortgage interest rates are closely tied to the government bond market, so mortgage rates will rise as well. (US mortgage rates rose from 3.88% to 4.35% just over the last week!) And if government deficits skyrocket, programs will need to be cut, so the massive support they are currently providing for the mortgage market will be in jeopardy, threatening even further rate increases.

Still, two cycles that we will discuss in the next post about cycles argue for that 2015 date.

* * *

I would like to make one thing very clear: If you woke up tomorrow and heard that a large “systemically important” international bank had collapsed, causing chaos in the rest of the financial system, and that most banks would be closed for some number of days, would you really be surprised? Probably not. Many people are starting to get the idea that the system is not exactly solid. I am certainly in that camp. So when I talk about August 2013 or some month in 2015 as the month when the real systemic collapse will commence, please know that, in my view, the more-than-sufficient conditions are in place for that full system collapse to happen at any minute. Discussions like the one above are an attempt to get a handle on probabilities. In terms of preparation, acceleration is not to be trifled with: I think that everyone should be doing what they can to be prepared now. If it turns out there is more time for preparation, fabulous, this type of preparation takes awhile and I’m sure we can all use the time. But that time may be short indeed. As the photo at the top of the post shows, when change arrives in your area, it may be monumental change.

A Forecast for the Next Eleven Years

Today we’ll review one of the single best pieces of economic / political / social analysis I’ve been lucky enough to see. Read this post and you’ll have an extremely important input for how the world will proceed over the next eleven years. How can I make such a statement? Because this analysis landed on my screen in December, 2007, and it covered the time period from 1995 through 2024, and it has been working extremely well. I promised more about cycles. This is from the world of cycles.

Understand this analysis and you will understand what Ben Bernanke of the US Federal Reserve has publicly admitted has been befuddling him and his colleagues.

At the time of publication at the end of 2007, this analysis said that we had reached a major turning point: That while the period from 1995 through 2007 had been characterized by optimism (think of all the “new era” talk), manias (think bubbles in stocks and real estate), high confidence, free enterprise, free trade, globalization, unfettered capitalism, and so forth–all of which had clearly been at the forefront during that period–that the period from 2008 through 2024 would be characterized by caution, fear, contraction, pessimism, restrictions on freedom, economies planned by the state, trade barriers, low confidence, and so forth. Here is part of what was presented:

Manfred_Pluto_Switch_ed

To put it mildly, an awful lot of people would have benefited if they had known about this huge switch that did occur, just as predicted, in January 2008. It really was as if, at the end of 2007, someone threw a big switch and changed things dramatically. Central bankers and politicians around the world are still scratching their collective balding heads about why all of the things they used to do in the past, things that would work to stimulate economies, are barely working today. At first they used their old tried-and-true methods–lowering interest rates, feigning confidence, stuffing cash into the banks, spending money on stimulus plans–and they got an anemic recovery at best. So they pulled out the really big guns. “Unconventional” methods, as they call them. Also known collectively as printing money. Lots of it. Enough since 2009 that they have basically tried to add the equivalent of one year of the US economy to the global economy.

What has it got them? Well, since the printed money went into buying assets rather than creating jobs, the rich and their vendors–Sotheby’s, Porsche, Armani, et al–have done very well. Everyone else, not so well. The huge divide between rich and poor is widening at an accelerating pace. Historically, that has always been a dangerous setup. You can only push people so far before they push back. Sometimes fiercely. Overall, what it got them was continuing recession and debt crises in Europe, a US economy with paltry growth at best, and China joined the club of getting themselves over-indebted to keep their economy growing, but now that excess of debt is coming back to bite them and their economy is rapidly losing steam. Japan remains in near-continuous recession no matter what they do.

Since the analysis above has been working remarkably well for 18 years, it makes a whole lot of sense to figure that it will keep working for the next eleven years. That was the claim for this cycle, that it would have two phases, one from 1995 through 2007, and the second, radically different in tone, from 2008 through 2024.

What could be the cause, the source, of such an influential cycle, one that seems to have changed the energetic tone for the majority of people, from excessive optimism from 1995–2007, to caution from 2008–2024? Let’s show more about what the top of that table looked like when presented in December 2007, right at the point of the big switch:

Manfred_Pluto_Switch_ed2

The table was astrological in nature.  It showed what was about to happen as Pluto moved  from Sagittarius into Capricorn.

This outstanding piece of analysis was put forth by Manfred Zimmel through his web site  in his Forecast Issue for the year 2008. At the web site, you can sign up for his free newsletter or paid subscription service. The information above was given to his paid subscribers only.

Now I know that some readers here have a low opinion of astrology. I would say two things about that: First, I agree that popular astrology as shown in daily newspapers and glossy magazines is worse than useless. Second, as with most complex fields of endeavor, there is a small group of practitioners doing excellent work and a much larger group of practitioners who do not. But excluding astrology from one’s view of the world precludes access to information like the above, which can be exceptionally useful in guiding real world decisions. Also, it can provide an outstanding “truth filter” for claims about the world. For example, the article at this link contains five predictions Bernanke made in 2008 that, armed with the information above, one could see at the time that these were more than likely to be wrong. They turned out to be, in fact, entirely wrong:

1/10/08 — The Federal Reserve is not currently forecasting a recession. WRONG

2/27/08 — I expect there will be some failures [among smaller regional banks]… Among the largest banks, the capital ratios remain good and I don’t anticipate any serious problems of that sort among the large, internationally active banks that make up a very substantial part of our banking system. WRONG

4/2/08 — In separate comments, Mr. Bernanke went further than he had in the past, suggesting that the Fed would remain aggressive and vigilant to prevent a repetition of a collapse like that of Bear Stearns, though he said he saw no such problems on the horizon. WRONG

6/10/08 — The risk that the economy has entered a substantial downturn appears to have diminished over the past month or so. WRONG

7/16/08 — [Fannie Mae and Freddie Mac are] adequately capitalized. They are in no danger of failing… [However,] the weakness in market confidence is having real effects as their stock prices fall, and it’s difficult for them to raise capital. WRONG, they needed bailouts to the tune of $160 billion.

The point here is that automatically excluding information because of its source can put a person at a distinct disadvantage in understanding how the world works and where it is heading. Anyone who has read more than a couple of my posts knows that I regularly give the US Federal Reserve a well-deserved lambasting for its lies, its attempts to get over-indebted people to borrow and spend more, and its only real goal: protecting the stranglehold that the large banks have on our society. But I used one of their reports in 2005 to decide when to sell out of real estate. They published a great research paper in 2005 that analyzed the history of maybe 30 real estate booms and busts from many countries. They said that real estate bubbles popped in the following manner: once sales volume peaked, price peaked, on average, six months later. US sales volume peaked in October 2005, and the US price peak was in June 2006, so their estimate was quite good. I took their research seriously and sold in Feb 2006. They, however, did not take their own research very seriously, at least in their public statements. Here are some quotes from Bernanke in 2007 (I won’t bother putting the WRONG label after each.):

7/1/2005CNBC interview:

INTERVIEWER: Tell me, what is the worst-case scenario? We have so many economists coming on our air saying ‘Oh, this is a bubble, and it’s going to burst, and this is going to be a real issue for the economy.’ Some say it could even cause a recession at some point. What is the worst-case scenario if in fact we were to see prices come down substantially across the country?

BERNANKE: Well, I guess I don’t buy your premise. It’s a pretty unlikely possibility. We’ve never had a decline in house prices on a nationwide basis. So, what I think is more likely is that house prices will slow, maybe stabilize, might slow consumption spending a bit. I don’t think it’s gonna drive the economy too far from its full employment path, though.

10/20/05: BERNANKE: House prices have risen by nearly 25 percent over the past two years. Although speculative activity has increased in some areas, at a national level these price increases largely reflect strong economic fundamentals. (Ha!)

So, acting on the Fed’s research can be very helpful. Acting on their opinions and forecasts is a mistake. They aren’t trying to help you, they are trying to help the banks. Anyone who understands that distinction can put Fed forecasts in the proper perspective.

So the next time you hear rosy predictions about the great recovery that is turning out to be perennially “just around the corner,” whether those predictions are from someone who is mistaken or someone with malevolent intent, now you can understand that what these forecasters are up against is this: for an economy based on debt to grow, they need to get people to borrow more money. And until 2024, people are under the influence of Pluto in Capricorn, and most of them don’t really want to take on more debt. Quite the contrary, a lot of them have replaced the notion of “how much debt can I qualify for” with a wish to have less debt. Many have now seen the slavery of debt and they didn’t like what they saw.

Perhaps after 2024 the economists will be able to stimulate the majority’s “animal spirits” again. The question is: can this financial system, which depends on the constant growth of debt, survive through 2024 with people not wanting more and more debt?  I decided quite some time ago that the answer is no and persistently take those pleasant actions that ready a person for financial system collapse.  I take the influence of this Pluto “big switch” as a small but important part of the energetic change bringing us the long-awaited Transition.

Thanks to Manfred Zimmel for permission to reprint this excellent piece of research.