“Britain faces choice of saving town or country from floods”

That title is a quote from the chairman of the UK Environment Agency informing people that there is no way the country has the money to save–that is, build flood defenses for–both city and rural areas:

     Britain faces choice of saving town or country from floods, says agency chief

What’s happening in Britain is a perfect example of what people in an increasing number of regions are facing: a relentless parade of major, deadly storms. Decades back, England was William Blake’s “green and pleasant land,” celebrated for its mild weather with the occasional major storm. Now it’s a rare week that doesn’t have 100mph winds strafing some part of the British Isles. Here’s a bit of high surf in Wales:

UK124826

(Photo source: Huge waves smash into British coastline, swells up to 75 feet recorded off-shore, UK government considers establishing tsunami-warning system)

And a lighthouse in Cornwall:

Cornwallarticle_2554557_1B4C531B000005

(Photo source: UK storms: While some FLY in 80 mph winds, others wade through murky water to salvage what little they have left (amazing photos) )

Even where houses are not on coasts or in flood plains, 1.6 million homes are said to be at risk of flooding from the water table rising.

From the BBC:

     10 key moments of the UK winter storms

And CNN:

     Atlantic storm brings more misery to drenched Britain: heaviest rainfall in 250 years

     UK government sends 5,000 military personnel to flood zones as hurricanes keeping coming

Somerset1622103_214327935429018_188120

(Photo source: UK Floods Could Last Months, Scientist Warns  )

*  *  *

Food For Thought

The bigger question is whether the UK Environment Agency will be able to save town or country. In my view, they won’t have the time or money to save either. How often do people have to hear about unprecedented winds, rain, and waves–storms that almost everyone now realizes are ramping up in intensity, not receding–before they move away from coasts, flood plains, and low-lying areas? Perhaps some few will move to high ground, but it’s almost certain that most will not. Most, even faced with complete destruction of their homes, show a Monty Pythonesque “bravado and derring-do” and vow to rebuild on the same spot, egged on by clueless newscasters and politicians. As someone who studies cycles, I conclude that, if every culture on the planet has, in their oral and written traditions, reports of floods that totally cleanse the land, there is a reason. And it isn’t because there was one really big worldwide flood. It’s that cyclically, repeatedly, the Earth’s surface gets an intensive cleansing. From the way we are treating the planet, isn’t it obvious why? If the Earth didn’t do this cyclic cleansing of its own surface, would there be any humans here at all? As I said: food for thought. I know many will reject such thinking. All I am suggesting is that eyes and minds be kept open to the steadily emerging evidence.

For example, the British storms have swept away the sand from many beaches. Here’s a story that the storms uncovered human footprints from 800,000 years ago. If that’s correct, then we could be talking about lots of cycles:

     Ancient footprints dating back 800,000 years found in Norfolk


Transition Update: Climate, Sea Level, and Weather

Carbon dioxide levels in the atmosphere reached 400 parts per million for the first time in 3 million years:

     Climate Milestone: Earth’s CO2 Level Passes 400 ppm

But something even more important might be emerging. For years, there have been some who predicted that when the Arctic sea ice melted, that the tremendous quantities of methane stored in the Arctic sea floor above Russia and North America would begin to be released into the atmosphere. The process would become an escalating feedback loop where the retracting ice reflected less sunshine back into space, the open water absorbed more sunlight, heating the water, forcing the ice to retract further, etc. Then the increasingly warming water would warm the sea floor, releasing the methane frozen there.

The methane release is considered to be important in the extreme because, as a greenhouse gas, methane is said to be twenty times more influential than carbon dioxide; and the amount of methane stored in the Arctic is said to have more heat-producing capacity than all of the other fossil fuels combined. Whether that quantity claim is perfectly accurate or not, it is agreed that there’s a lot of methane there.

The release of the methane would then accelerate the feedback loop by rapidly warming the atmosphere so that ultimately people would be calculating sea level rise in meters per decade rather than centimeters.

Now a multi-nation task force claims that there has been a dramatic increase in methane emissions in the Arctic. They say the process has recently escalated beyond their expectations. They believe a runaway feedback loop has likely begun and that the arctic could see an ice-free Summer by 2015 rather than the more generally-accepted predictions that this would not happen till sometime between 2030 and 2050.

Here’s an image showing, from left to right, the average minimum sea ice from 1979-2000; the previous record minimum set in 2007; and the new record set in 2012, from this link:

ArcticSeaIce2012

This gives an indication of the trend, though that trend also includes a persistent and significant thinning of the ice as well, which is not pictured.

Over the last year, those who monitor Arctic methane using aircraft flyovers say that large plumes of methane, some as wide as a kilometer, can be detected above both open Arctic sea water and cracks in the sea ice. This is a new development. Previously, only small plumes could be detected, and typically only near the Siberian coast where methane was escaping from melting permafrost on land. Strong methane emissions from the ocean floor can be seen in the 19 minute video Arctic Methane: Why The Sea Ice Matters. The video does an excellent job of explaining a lot of this and notes that, like many other places on the planet (see What is the Transition? Part 1), the Arctic is seeing an increase in seismic activity that could contribute to additional methane releases.

More can be read about this topic here.

These folks are also studying how changes in the Arctic are causing or contributing to global weather extremes. While I was writing the What is the Transition series, one of the largest storms ever seen developed in the Atlantic, stretching from Canada to Portugal, Greenland to the Caribbean:

     Incredible North Atlantic storm spans Atlantic Ocean, coast to coast

Storm_20130328

Because there was no human body count, the mainstream media ignored it, so few heard about this late-March megastorm. It did contribute to unusually wintry weather in the UK, killing many animals there.

Saturn also had a mega-storm, so some of the energies we are encountering are likely related to our Solar System, not just our planet:

     First Images of Giant Hurricane Swallowing Saturn

Back on Earth, the flooding from storms just keeps on coming:

     Update: ‘Tsunami of rain’ hits Buenos Aires – Death toll rises to 54 as millions left without power and water – Event was ‘deluge without historical precedent’

     Texas floods as up to seven inches of rain falls after storms hit much of the South

     Flash floods kill 16 in Saudi Arabia after heaviest rainfall in 25 years

     Evacuations ordered as flooding hits eastern France

     Nearly a foot of rain falls in Jackson County, Mississippi

     Death toll from north Afghanistan flash flooding rises to 20

     Record flooding threatens Midwest, Mississippi river

And John Stevanovic continues to produce monthly video summaries of weather extremes, earth changes, meteors, and so forth. I do not agree with his “end of the world” belief—as stated previously, I think we are in a major transition that will ultimately result in better times for humanity—but John’s videos do show compelling evidence of the accelerating turbulence that is contributing to the change we are experiencing:

     Extreme weather events and Earth Changes in March 2013

     Extreme weather events and Earth Changes, April 2013

And if you are reading this in mid-May, 2013, you might wish to check in daily with Spaceweather.com. Sunspot AR1748 has already thrown off four X-class solar flares. Luckily, the CMEs (coronal mass ejections) from those flares have not been sent directly toward Earth, but the rotation of the Sun is bringing AR1748 into more direct alignment with the Earth in the coming days. Images of the four X-class flares are here.

What is the Transition? Part 3

Sea Level Rise

Have you ever seen a film of a three mile by one mile chunk of glacier falling into the sea? If not, and if you have four minutes to spare, now you can, by clicking on this link for an excerpt from the film Chasing Ice, which concludes, by the way, with a classic example of acceleration.

It helps to see films like that since the noise in the media on sea level rise is nearly deafening. A $120 million war chest can be used to make a lot of noise:

     Secret funding helped build vast network of climate denial thinktanks

Folks like these, joined by the industry spawned by the fossil fuel companies and oil exporting countries, stridently deny lots of things about climate change. In fact, some of them claim that we are right on the verge of a new ice age.  They often seem to feel the need to yell rather loudly to drown out stories like this:

     Satellites reveal sudden Greenland ice melt

     Melt ponds cause the Arctic sea ice to melt more rapidly

And charts like this that show the longer term trend for Arctic sea ice (source):

ArcticSeaIceTrend

and of course the chart of sea level rise itself:

GlobalSeaLevelTrend

Claims and counter-claims aside, there are, undeniably, people losing their homes to rising sea levels:

     Papua New Guinea: Carteret Islands: ‘The sea is killing our island paradise’

The people of the Carterets, for 300 years ignored by all but a few passers-by, can lay claim to a dubious distinction: within the next six months, some 240 of them – 40 families – will leave for good, driven from their homes by sea-level rise. In five years, half of the population, estimated at 2,500 people, is expected to have been evacuated to bigger, less vulnerable islands, some of the first refugees displaced as a result of man-made global warming. Some believe the islands will be uninhabitable by 2015.

     The view from beneath the waves: climate change in the Solomon Islands

The smaller outer islands in the Solomon Islands are already seeing devastating impacts of the rising sea level. The impact of climate change is already affecting the rural population of Solomon Islands, an archipelago of eight bigger islands and hundreds of small, mostly uninhabited islands…Taro, the staple root crop in Ontong Java atoll, is dying due to salinity of the swamp and sandy soil. And graves at the Tuo village cemetery, an island in the eastern Solomons have been exposed by eroding waves.

During the 1980s the burial place was about 50m away from the beach. Today the beach is about 1m with only one cross remaining as the rising sea had washed most away.

     Vanishing point

Unless Tuvaluans adopt the lifestyle of the Marsh Arabs and build their houses on stilts over water, and that’s where they live 24 hours a day, eventually most, if not all, of the island will become uninhabitable.

     Micronesia: A Third Kind of Nation, Written Off?

“Even the dead are no longer safe in my country,” Micronesia’s Ambassador to the UN told ABC News at his mission’s offices on a rainy day in New York.

He gave us recent digital photos of his home islands.

In one, a man stands shin-deep out in a calm and sunny sea … where a cemetery used to be.

In others, colorful traditional burial grounds spill out of a wave-eroded bank onto the tiny remaining beach, and water surges inland past tumbled houses.

     Sea change: the Bay of Bengal’s vanishing islands

     Paradise lost?

The tiny Pacific island nation of Palau is a paradise on earth. This band of several hundred islands is home to some of the world’s most stunning marine life, and to the twenty thousand people who live there.

But like many low-lying nations across the world, Palau is threatened by the effects of climate change and sea-level rise.

Palau’s coasts are being eroded, its local farmlands tainted by seawater, and its valuable reefs threatened. Johnson Toribiong, President of Palau, calls the damage he’s witnessing “a slow-moving tsunami.”

Kiribati, the Maldives, Torres Strait Islands, Cook Islands, many small islands of the Philippines, and the inhabited areas Barbados–all are getting inundated.

And it isn’t just the small islands that are having trouble. Large cities like Jakarta are facing dual difficulties: sinking land from the draining of freshwater aquifers combined with rising sea levels (source):

Experts in Indonesia are preparing to build a huge wall to stop the ocean from swamping parts of Jakarta.

Some suburbs in the capital already go underwater when there is a big tide but the problem is expected to get even worse.

Jakarta is sinking by up to 10 centimetres a year and Indonesia’s national disaster centre says with oceans rising, large parts of the city, including the airport, will be inundated by 2030.

Flooding and high tides are already causing problems for some residents in the city of 10 million people.

New York is still suffering the effects of the elevated storm surge from Superstorm Sandy.

London completed the Thames Barrier in the early 1980s to deal with rising tides boosted by increasingly powerful storms. They raise the barrier in the Thames when rising ocean waters threaten to flood London and the Thames Valley. In the 1980s, they raised the barrier 4 times; in the 1990s, 35 times; and from 2000 through 2010, 80 times.

And according to Scientific American, Shanghai, which means “above the sea” is finding itself on its way to being below the sea. The city has spent billions of dollars fending off the encroachment of the sea:

But the city’s biggest concern remains the slow, steadily mounting threat that comes from sea level rise. Higher tides are washing away the precious delta soil upon which the city’s foundations are built, and water supplies are becoming more tainted as seawater intrudes more deeply into the fresh water of the Yangtze.

Species Extinction

It seems that major changes in conditions on the planet give rise to the extinction of a large number of species. This has happened five times in the last several hundred million years. The most recent such event saw the demise of the dinosaurs. Some observers—such as the US Geological Survey for the chart below—offer data that points to the idea that we are in the middle of the sixth such mass species extinction event:

SpeciesExtinction

This indicates that the changes we are experiencing are way beyond trivial.

Here is Part 4.

What is the Transition? Part 2

An Important Weather SHIFT

This is not a contribution to the raging global warming debate in which some people who pretend to be civilized threaten those who disagree with them with torture and death.

And it’s about a weather trend, not what happened last week in one place.

This is about a global weather shift. And if this shift is correctly described below, then it has major consequences. But almost no one is talking about it.

In their local areas, this shift has been apparent to North American gardeners for years, as they have been increasingly able to grow plants farther north than previously possible. The first map below is the USDA (US Dept. of Agriculture) Plant Hardiness Zone map published in 1990. It told gardeners what plants would survive in their geographical zone, but gardeners learned to “cheat” the zones in recent years, growing plants rated for one zone south of their garden. The second map below was a revised zone map published by the Arbor Day Foundation in 2006 because they knew the USDA 1990 map was seriously out of date (the maps are from Mother Jones):

USDA1990ArborDay2006
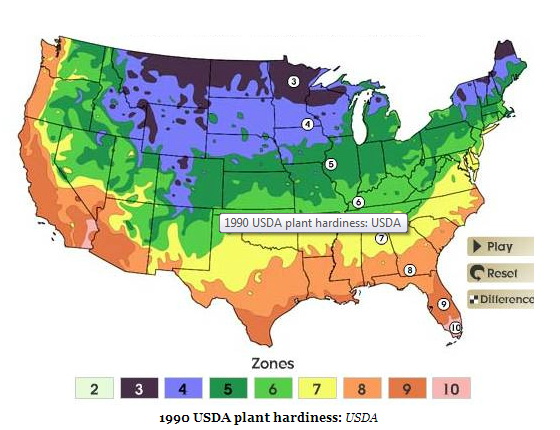
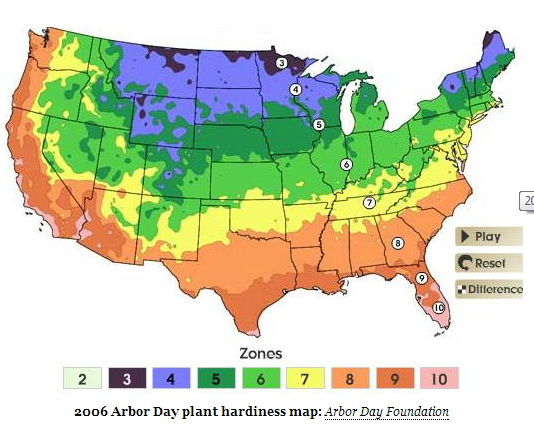
Notice how Zones 3 and 4, for example, shifted north, in some places by hundreds of miles, indicating warmer temperatures farther north.

In 2012, the USDA published their own new zone map and admitted that the “new map is generally one 5-degree Fahrenheit half-zone warmer than the previous map throughout much of the United States.” So they admitted that the lowest temperature to be expected in many areas was five degrees F greater in 2012 than it was in 1990!

That same warming trend was bringing heat and drought farther north each year. For a decade, Northern Mexico has been struggling with heat and drought. In 2010 and 2011, this condition moved into Texas with a vengeance, bringing scorching heat and a lot of wildfires. In 2011, the wildfires spread to New Mexico and Arizona, with Colorado often experiencing smoke from these fires. In 2012, winter temperatures averaged six to seven degrees F above normal in Colorado, and by Spring, the fires arrived en masse in Colorado and Utah, and by Summer, even into Wyoming and Montana:

     Colorado farmers are facing disaster

During the Summer, more than 60% of the counties of the lower 48 states of the US were declared drought disaster areas.  And this Winter has been far milder than normal in most of the US:

     U.S. Agriculture Secretary: 2013 already a drought disaster

America’s first official disaster areas of 2013 were designated because 597 counties have experienced severe drought conditions for eight consecutive weeks, according to the U.S. Drought Monitor.

Last year, 2,245 counties in 39 states were declared disasters by the USDA. With continued drought projected for much of the United States, farmers may have another hard year ahead of them.

     2 Great Lakes hit lowest water level on record

…the lakes…declined 17 inches since January 2012.

     Chicago expected to tie record for lack of snow

Chicago’s mild winter reaches another milestone on Tuesday: 319 days without an inch of snow falling.

That ties the record set in 1940. Wednesday will break the record and, with temperatures forecast to surge into the 50s Friday and Saturday, the record streak will continue.

     Low water may halt Mississippi River transport next week

And a good summary:

     2012 was hottest year on record for Lower 48 states

The average temperature was 3.3 degrees higher than in the 20th century…

Last year was the hottest year on record for the contiguous 48 states, marked by near-record numbers of extreme weather events such as drought, wildfire, tornadoes and storms, according to the National Oceanic and Atmospheric Administration.

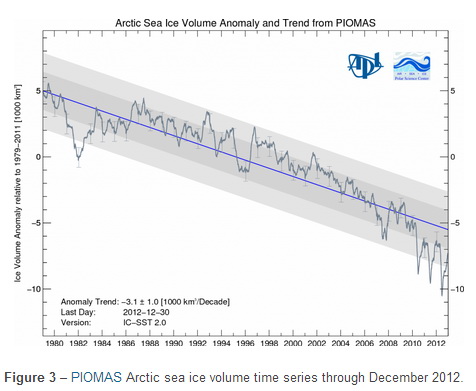
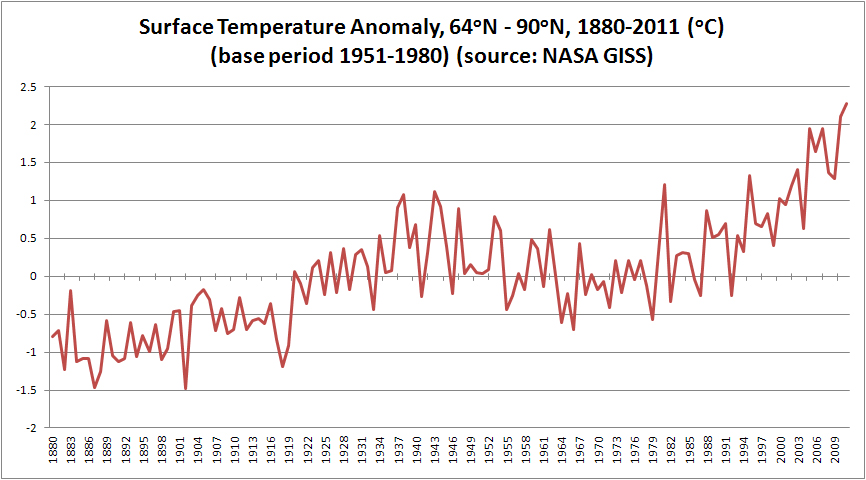
And surface temperatures in the Arctic have been rising for years. Here is the longer-term chart:

arctice-north-latitudes-surface-temp-trend-annual-thru2011

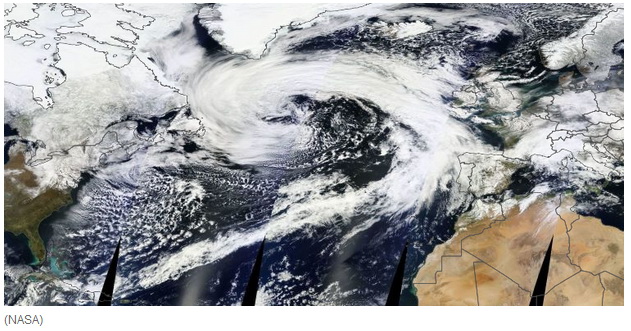
While the US heats up, Canada’s winters become more mild, and the surface temperature rises in the Arctic, there have been increasingly fierce and deadly winters over the last few years on the other side of the North Pole, especially in eastern Europe. From 2012:

     Europe death toll rises in big freeze

     Blizzards hit eastern Europe hard

And from 2013:

     Pyrenees ski resorts top world snow charts with over 7 meters (23 feet) of snowfall in one month

     Heaviest snowfall in many years hits Polish-Slovakian border

     Snowiest winter in 100 years paralyzes Moscow

     New satellite image shows the unusually frigid and snowy conditions that blanketed much of Great Britain

     Heavy snowfall closes dozens of roads in Turkey

     Record snowfall closes lifts and roads in the Pyrenees

     Snowpocalypse Russia: ‘Snow tsunami’ swallows streets, cars, buildings

     Europe hit by blizzards, air traffic havoc, deaths

     Croatia snowfall shatters record set in 1861

     Snow blankets parts of Middle East, Jerusalem

     ‘Lowest temperaure in Bangladesh’s history’ brings at least 80 deaths

     Unprecedented cold spell breaks 50-year records in Pakistan

     Heavy snow, torrential rain, gale-force winds batter Greece

     Russian Trans-Caucasian highway closed due to heavy snowfall

     China’s extreme cold snaps records

     More than 100 dead as cold snap hits India

     Record cold snap grips Korean Peninsula

     Coldest winter in decades for Russia with snow as much as 5 meters (16½ ft) deep – Plows cannot reach roads to clear them

And I can go back to 2012 headlines and find a lot more of the same, though, as usual (as always???), the trend accelerated in 2013.

Admittedly, claiming trend changes for weather is a dicey business. Weather has a knack for frustrating those who declare trends. But there is strong evidence for a rather persistent procession of heat marching north toward the geographic North Pole in the Western Hemisphere and cold moving south from the Pole in the Eastern Hemisphere.

So, if that’s right, what could be the cause?

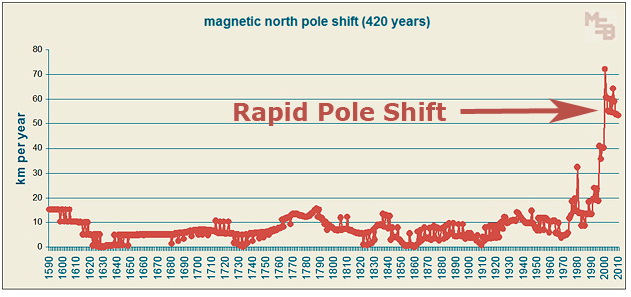
Well, there’s another well-known phenomenon making a similar directional march. Here are some graphics from ModernSurvivalBlog.com that track the movement of the magnetic North Pole, with the data supplied by conventional scientific organizations such as NOAA. Here is an animated gif of the movement over the last 400 years:

magneitic-north-pole-shift-400-years (1)

And here’s the last 150 years:

magneitic-north-pole-shift-50-year-periods-last-150-years

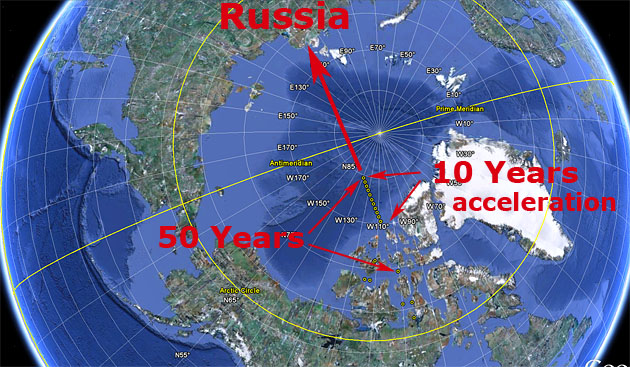
And over the last 50 years:
magnetic-north-pole-is-heading-to-russia

From the creator of these graphics:

Since 1860, the magnetic pole shift has more than doubled every 50 years…During the past 10 years, the magnetic north pole has shifted nearly half of the total distance of the past 50 years!

Here’s another way to look at the accelerated movement:

MagneticPoleShiftHistory

Where is the pole heading? In the direction of Siberia. All this is not woo-woo information, airports that paint magnetic compass readings on their runways are having to repaint those number every several years.

What’s happening is that, depending on where you are, a compass reading can change by one degree every five years.

The magnetic South Pole is doing the same type of movement away from the geographic South Pole, having moved off the land mass of Antarctica years ago.

Most simplified graphics of the Earth’s magnetic field look something like this:

Earth_geomag

So the question is: Is weather moving with the movement of the magnetic poles? Another way to frame the question: At the magnetic poles, the Earth’s magnetic field captures charged particles flowing from the Sun on the solar wind and directs them toward the surface, an effect visible in the extreme northern and southern latitudes as the Aurora Borealis and Aurora Australis. Is the same energetic pattern also delivering the coldness of space to the planet’s surface? Or is it the relative thinness of the magnetosphere at the magnetic poles?

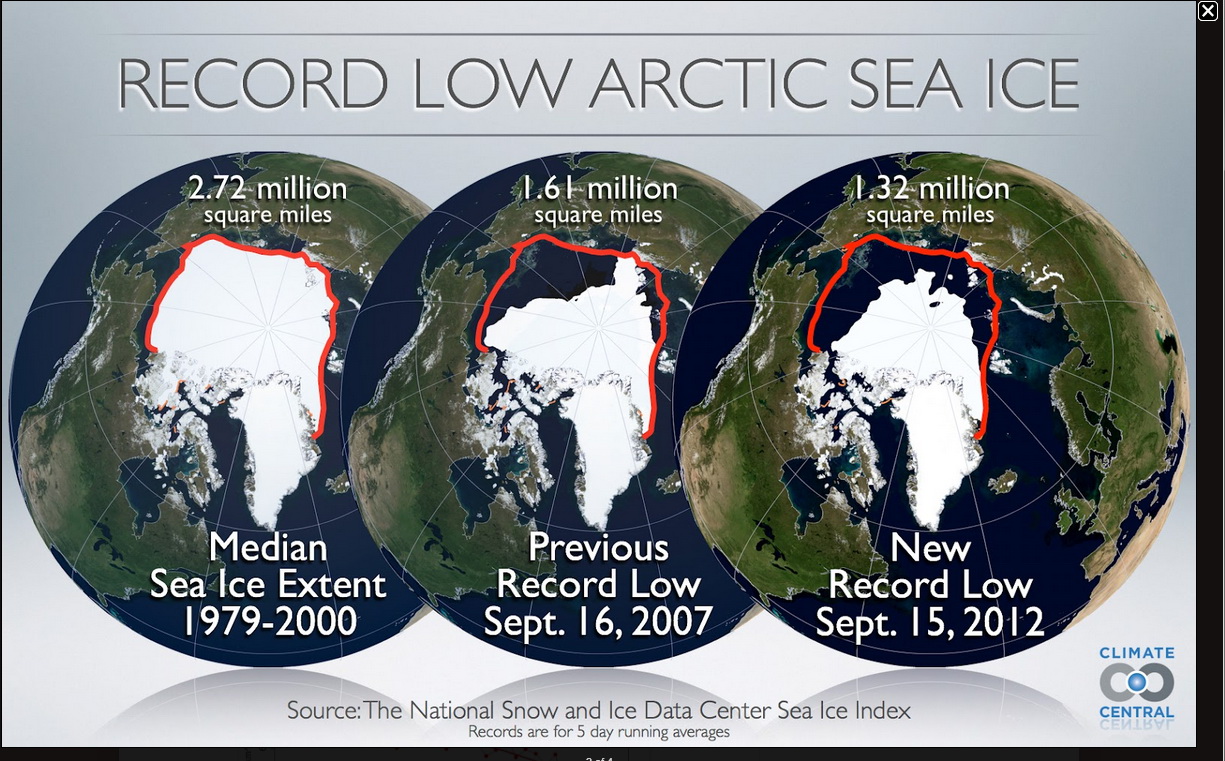
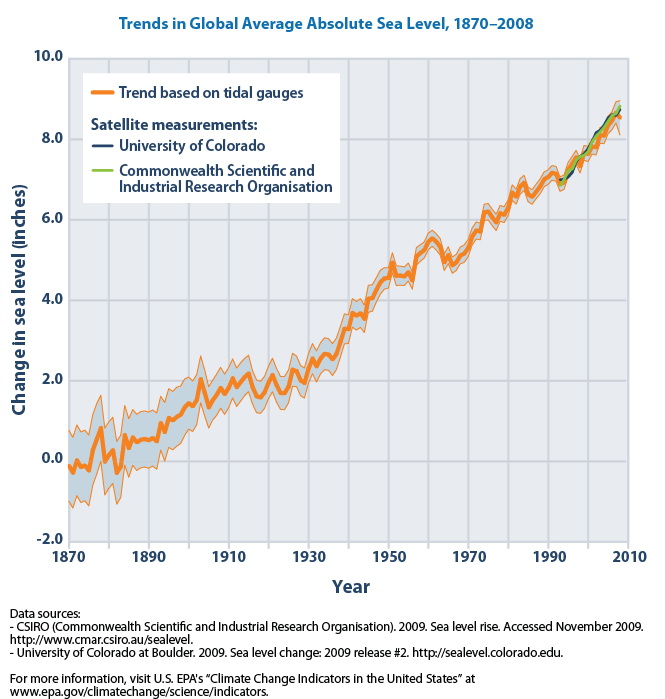
Well, if it’s correct that this coldness is moving with the magnetic poles, why should anyone care? Because if substantial coldness is moving away from the traditional locations of the geographic poles in Arctic and the Antarctic, then it would seem that the ice at the geographic poles would melt far more quickly than most would expect before equivalent new formations of ice could develop, particularly in the South Pacific where there is no landmass nearby. Perhaps I am uninformed, but I have not heard that such an effect is being accounted for in anyone’s climate change model. And as shown at the beginning of this post, the movement of heat north through North America from the south is proceeding rapidly. If this continues, or more likely accelerates, there might be a whole lot more melting of polar ice caps than previously expected, raising sea levels faster than almost anyone anticipates.

And perhaps my effort above was feeble, but there is a lot of evidence out there for this weather shift. So why are so few talking about it? Clearly, because it doesn’t fit people’s models of how things work. Magnetic pole movement is straight out of conventional science, while the idea that it would impact the weather is not. The solution for most? Ignore the evidence.

What is the Transition? Part 3 is here.