What is the Transition? Part 4

After a brief mention of other natural changes, I would like to move on and treat a difficult trend that is at the intersection of human activity and earth changes, followed by discussions of the effects of acceleration on people.

Other Earth Changes

There are other observable changes in the natural world such as:

–SINKHOLES: There has been a rapid increase in reports of sinkholes. No one keeps statistics on these, at least not yet. But ask yourself: twenty years ago, how often did you hear about sinkholes? Now, it’s tough to go a week or two without a report:

     Chinese village suffers over 20 sinkholes in five months

     In just one month, more than 40 huge sinkholes open up all over Harrisburg, Pennsylvania’s capital, but the city is too broke to fix them

     Russia: Giant Sinkhole in Dagestan

     Giant sinkhole swallows building in Bundaberg, Queensland, 10 more at risk

     Amazing pics of a hole that opened up the earth 

     Enormous sinkhole swallows buildings in Guangzhou, China

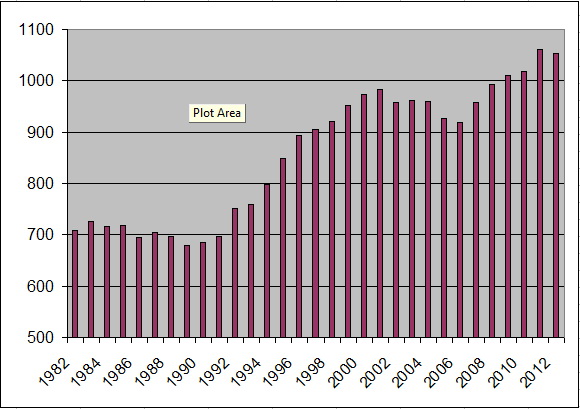
Sinkholes are becoming a worrying problem in China. In 2007, there were 54 sinkhole collapses, and by 2009, that number was all the way up to 129. According to one estimate, between July 21st and August 12th 2012, 99 sinkhole collapses occurred just in Beijing.

     The Great Collapse: crust weakening, slipping, and collapsing across the planet – UK, Spain, Kashmir, China, U.S.

–ASTEROIDS, fireballs in the sky: The world of youtube has been showing what appears to be quite an increase in meteorites/fireballs over the last several years. Within the last three months, however, these have gone mainstream media:

     Newfound Asteroid Buzzes Earth Inside Moon’s Orbit — Asteroid 2012 XE54 was discovered in December just two days before passing Earth inside the moon’s orbit;

Then there was the meteor that hit Russia on Feb 14, shown all over the web, including here and here; and,

     2012 DA14, which passed inside the orbit of geosynchronous communication satellites, missing the planet by 17,000 miles on Feb 15.

–COMETS: Of the many comets that pass the earth each year–most of them not visible to the naked eye–there is great interest among comet-watchers in one scheduled for this year, called 2012 S1 (ISON), which has the potential to become exceedingly bright and which some comet watchers claim will have important influences on Earth.

We will delay further discussion of this asteroid and comet phenomenon for the upcoming section of this series that deals with Predictions, though it seems worthwhile to note that Russia and all of us were very lucky: that meteorite in Russia exploded near Chelyabinsk where large amounts of nuclear waste and dangerous industrial chemical wastes are stored. We are all fortunate that the meteorite did not strike these directly, which leads in to the next topic.

Nuclear Power Plants

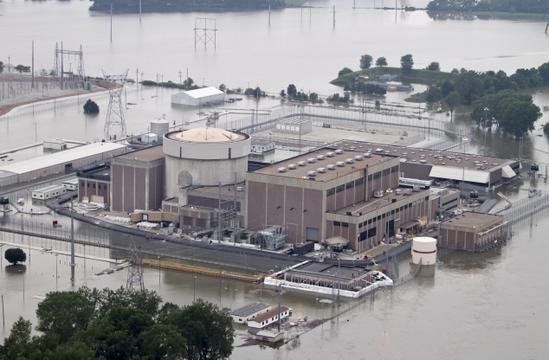
Virtually all nuclear power plants are situated adjacent to a body of water that is typically used to cool the plant. With the major trend increases in storms, floods, tsunamis, and earthquakes documented in Part 1 and Part 2, combined with decades of “profits above all else” at many of the corporations running these nuke plants, to say that this situation is dangerous requires a new category well beyond understatement.

     US: Flood Berm Collapses at Nebraska Nuclear Plant

Nuc578314d46fa641a9940e57967a65d6

     UK nuclear sites at risk of flooding, report shows

As many as 12 of Britain’s 19 civil nuclear sites are at risk of flooding and coastal erosion because of climate change, according to an unpublished government analysis obtained by the Guardian.

Nine of the sites have been assessed by the Department for Environment, Food and Rural Affairs (Defra) as being vulnerable now, while others are in danger from rising sea levels and storms in the future.

And of course we all know more than we ever wanted to know about what happens when a tsunami hits a nuke plant. If anyone thinks the Fukushima problem is over, they have been ignoring the news flow on that topic. Even in the unlikely event that there are no additional difficulties from the cores and spent fuel at Fukushima, the damage from the original event is not over:

     Tokyo almost as irradiated as Fukushima

     Bluefin Tuna Caught Near California Still Radioactive Years After Fukushima

     Meet Mike, The Most Radioactive Fish Ever From Fukushima

     More Fukushima nuclear pollution to hit U.S. starting in 2015

     Study: Contaminated water from Fukushima reactors could double radioactivity levels of US coastal waters in 5 years — “We were surprised at how quickly the tracer spread” (PHOTO & VIDEO)

While many consider Fukushima to be a one-off event, it seems to me that logic dictates that the acceleration in earth changes plus the location of these plants next to water means that we have an extremely unfortunate emerging trend on our hands.

In Part 5, I’ll begin treatment of the human side of acceleration and the Transition.

Guest Post: Your Plan

We interrupt the What is the Transition? series for this brief post by someone who does not wish their name to appear on the internet, and thus will remain anonymous for the time being:

There is much noise in today’s world. The still small thought-pattern voice of your soul, your higher self, must come through to your conscious mind if you are to fulfill the plan you made for your life.

This voice is not a voice in the normal sense. It is not noisy. It is quiet. It requires you to move your thoughts out of the way. And let that voice speak. And let it be heard.

That voice, that thought-form, that energetic pattern, can re-mind you of why you decided to wade into this oftentimes confusing world known as the physical plane, the Earth plane.

No one else–no medium, no writer, no guru–can tell you your plan, the major idea of your plan. It is up to you to retrieve it. Doing so will bring you great joy.

The clues are everywhere. For most, your whole life is a clue, your whole life is a set of clues, a series of preparations for carrying out your plan. Much else is also accomplished in this series. But the preparation is for a specific expression of your life stream.

Find it. Retrieve it. Implement it. You will not be disappointed.

What is the Transition? Part 3

Sea Level Rise

Have you ever seen a film of a three mile by one mile chunk of glacier falling into the sea? If not, and if you have four minutes to spare, now you can, by clicking on this link for an excerpt from the film Chasing Ice, which concludes, by the way, with a classic example of acceleration.

It helps to see films like that since the noise in the media on sea level rise is nearly deafening. A $120 million war chest can be used to make a lot of noise:

     Secret funding helped build vast network of climate denial thinktanks

Folks like these, joined by the industry spawned by the fossil fuel companies and oil exporting countries, stridently deny lots of things about climate change. In fact, some of them claim that we are right on the verge of a new ice age.  They often seem to feel the need to yell rather loudly to drown out stories like this:

     Satellites reveal sudden Greenland ice melt

     Melt ponds cause the Arctic sea ice to melt more rapidly

And charts like this that show the longer term trend for Arctic sea ice (source):

ArcticSeaIceTrend

and of course the chart of sea level rise itself:

GlobalSeaLevelTrend

Claims and counter-claims aside, there are, undeniably, people losing their homes to rising sea levels:

     Papua New Guinea: Carteret Islands: ‘The sea is killing our island paradise’

The people of the Carterets, for 300 years ignored by all but a few passers-by, can lay claim to a dubious distinction: within the next six months, some 240 of them – 40 families – will leave for good, driven from their homes by sea-level rise. In five years, half of the population, estimated at 2,500 people, is expected to have been evacuated to bigger, less vulnerable islands, some of the first refugees displaced as a result of man-made global warming. Some believe the islands will be uninhabitable by 2015.

     The view from beneath the waves: climate change in the Solomon Islands

The smaller outer islands in the Solomon Islands are already seeing devastating impacts of the rising sea level. The impact of climate change is already affecting the rural population of Solomon Islands, an archipelago of eight bigger islands and hundreds of small, mostly uninhabited islands…Taro, the staple root crop in Ontong Java atoll, is dying due to salinity of the swamp and sandy soil. And graves at the Tuo village cemetery, an island in the eastern Solomons have been exposed by eroding waves.

During the 1980s the burial place was about 50m away from the beach. Today the beach is about 1m with only one cross remaining as the rising sea had washed most away.

     Vanishing point

Unless Tuvaluans adopt the lifestyle of the Marsh Arabs and build their houses on stilts over water, and that’s where they live 24 hours a day, eventually most, if not all, of the island will become uninhabitable.

     Micronesia: A Third Kind of Nation, Written Off?

“Even the dead are no longer safe in my country,” Micronesia’s Ambassador to the UN told ABC News at his mission’s offices on a rainy day in New York.

He gave us recent digital photos of his home islands.

In one, a man stands shin-deep out in a calm and sunny sea … where a cemetery used to be.

In others, colorful traditional burial grounds spill out of a wave-eroded bank onto the tiny remaining beach, and water surges inland past tumbled houses.

     Sea change: the Bay of Bengal’s vanishing islands

     Paradise lost?

The tiny Pacific island nation of Palau is a paradise on earth. This band of several hundred islands is home to some of the world’s most stunning marine life, and to the twenty thousand people who live there.

But like many low-lying nations across the world, Palau is threatened by the effects of climate change and sea-level rise.

Palau’s coasts are being eroded, its local farmlands tainted by seawater, and its valuable reefs threatened. Johnson Toribiong, President of Palau, calls the damage he’s witnessing “a slow-moving tsunami.”

Kiribati, the Maldives, Torres Strait Islands, Cook Islands, many small islands of the Philippines, and the inhabited areas Barbados–all are getting inundated.

And it isn’t just the small islands that are having trouble. Large cities like Jakarta are facing dual difficulties: sinking land from the draining of freshwater aquifers combined with rising sea levels (source):

Experts in Indonesia are preparing to build a huge wall to stop the ocean from swamping parts of Jakarta.

Some suburbs in the capital already go underwater when there is a big tide but the problem is expected to get even worse.

Jakarta is sinking by up to 10 centimetres a year and Indonesia’s national disaster centre says with oceans rising, large parts of the city, including the airport, will be inundated by 2030.

Flooding and high tides are already causing problems for some residents in the city of 10 million people.

New York is still suffering the effects of the elevated storm surge from Superstorm Sandy.

London completed the Thames Barrier in the early 1980s to deal with rising tides boosted by increasingly powerful storms. They raise the barrier in the Thames when rising ocean waters threaten to flood London and the Thames Valley. In the 1980s, they raised the barrier 4 times; in the 1990s, 35 times; and from 2000 through 2010, 80 times.

And according to Scientific American, Shanghai, which means “above the sea” is finding itself on its way to being below the sea. The city has spent billions of dollars fending off the encroachment of the sea:

But the city’s biggest concern remains the slow, steadily mounting threat that comes from sea level rise. Higher tides are washing away the precious delta soil upon which the city’s foundations are built, and water supplies are becoming more tainted as seawater intrudes more deeply into the fresh water of the Yangtze.

Species Extinction

It seems that major changes in conditions on the planet give rise to the extinction of a large number of species. This has happened five times in the last several hundred million years. The most recent such event saw the demise of the dinosaurs. Some observers—such as the US Geological Survey for the chart below—offer data that points to the idea that we are in the middle of the sixth such mass species extinction event:

SpeciesExtinction

This indicates that the changes we are experiencing are way beyond trivial.

Here is Part 4.

What is the Transition? Part 2

An Important Weather SHIFT

This is not a contribution to the raging global warming debate in which some people who pretend to be civilized threaten those who disagree with them with torture and death.

And it’s about a weather trend, not what happened last week in one place.

This is about a global weather shift. And if this shift is correctly described below, then it has major consequences. But almost no one is talking about it.

In their local areas, this shift has been apparent to North American gardeners for years, as they have been increasingly able to grow plants farther north than previously possible. The first map below is the USDA (US Dept. of Agriculture) Plant Hardiness Zone map published in 1990. It told gardeners what plants would survive in their geographical zone, but gardeners learned to “cheat” the zones in recent years, growing plants rated for one zone south of their garden. The second map below was a revised zone map published by the Arbor Day Foundation in 2006 because they knew the USDA 1990 map was seriously out of date (the maps are from Mother Jones):

USDA1990ArborDay2006Notice how Zones 3 and 4, for example, shifted north, in some places by hundreds of miles, indicating warmer temperatures farther north.

In 2012, the USDA published their own new zone map and admitted that the “new map is generally one 5-degree Fahrenheit half-zone warmer than the previous map throughout much of the United States.” So they admitted that the lowest temperature to be expected in many areas was five degrees F greater in 2012 than it was in 1990!

That same warming trend was bringing heat and drought farther north each year. For a decade, Northern Mexico has been struggling with heat and drought. In 2010 and 2011, this condition moved into Texas with a vengeance, bringing scorching heat and a lot of wildfires. In 2011, the wildfires spread to New Mexico and Arizona, with Colorado often experiencing smoke from these fires. In 2012, winter temperatures averaged six to seven degrees F above normal in Colorado, and by Spring, the fires arrived en masse in Colorado and Utah, and by Summer, even into Wyoming and Montana:

     Colorado farmers are facing disaster

During the Summer, more than 60% of the counties of the lower 48 states of the US were declared drought disaster areas.  And this Winter has been far milder than normal in most of the US:

     U.S. Agriculture Secretary: 2013 already a drought disaster

America’s first official disaster areas of 2013 were designated because 597 counties have experienced severe drought conditions for eight consecutive weeks, according to the U.S. Drought Monitor.

Last year, 2,245 counties in 39 states were declared disasters by the USDA. With continued drought projected for much of the United States, farmers may have another hard year ahead of them.

     2 Great Lakes hit lowest water level on record

…the lakes…declined 17 inches since January 2012.

     Chicago expected to tie record for lack of snow

Chicago’s mild winter reaches another milestone on Tuesday: 319 days without an inch of snow falling.

That ties the record set in 1940. Wednesday will break the record and, with temperatures forecast to surge into the 50s Friday and Saturday, the record streak will continue.

     Low water may halt Mississippi River transport next week

And a good summary:

     2012 was hottest year on record for Lower 48 states

The average temperature was 3.3 degrees higher than in the 20th century…

Last year was the hottest year on record for the contiguous 48 states, marked by near-record numbers of extreme weather events such as drought, wildfire, tornadoes and storms, according to the National Oceanic and Atmospheric Administration.

And surface temperatures in the Arctic have been rising for years. Here is the longer-term chart:

arctice-north-latitudes-surface-temp-trend-annual-thru2011

While the US heats up, Canada’s winters become more mild, and the surface temperature rises in the Arctic, there have been increasingly fierce and deadly winters over the last few years on the other side of the North Pole, especially in eastern Europe. From 2012:

     Europe death toll rises in big freeze

     Blizzards hit eastern Europe hard

And from 2013:

     Pyrenees ski resorts top world snow charts with over 7 meters (23 feet) of snowfall in one month

     Heaviest snowfall in many years hits Polish-Slovakian border

     Snowiest winter in 100 years paralyzes Moscow

     New satellite image shows the unusually frigid and snowy conditions that blanketed much of Great Britain

     Heavy snowfall closes dozens of roads in Turkey

     Record snowfall closes lifts and roads in the Pyrenees

     Snowpocalypse Russia: ‘Snow tsunami’ swallows streets, cars, buildings

     Europe hit by blizzards, air traffic havoc, deaths

     Croatia snowfall shatters record set in 1861

     Snow blankets parts of Middle East, Jerusalem

     ‘Lowest temperaure in Bangladesh’s history’ brings at least 80 deaths

     Unprecedented cold spell breaks 50-year records in Pakistan

     Heavy snow, torrential rain, gale-force winds batter Greece

     Russian Trans-Caucasian highway closed due to heavy snowfall

     China’s extreme cold snaps records

     More than 100 dead as cold snap hits India

     Record cold snap grips Korean Peninsula

     Coldest winter in decades for Russia with snow as much as 5 meters (16½ ft) deep – Plows cannot reach roads to clear them

And I can go back to 2012 headlines and find a lot more of the same, though, as usual (as always???), the trend accelerated in 2013.

Admittedly, claiming trend changes for weather is a dicey business. Weather has a knack for frustrating those who declare trends. But there is strong evidence for a rather persistent procession of heat marching north toward the geographic North Pole in the Western Hemisphere and cold moving south from the Pole in the Eastern Hemisphere.

So, if that’s right, what could be the cause?

Well, there’s another well-known phenomenon making a similar directional march. Here are some graphics from ModernSurvivalBlog.com that track the movement of the magnetic North Pole, with the data supplied by conventional scientific organizations such as NOAA. Here is an animated gif of the movement over the last 400 years:

magneitic-north-pole-shift-400-years (1)

And here’s the last 150 years:

magneitic-north-pole-shift-50-year-periods-last-150-years

And over the last 50 years:
magnetic-north-pole-is-heading-to-russia

From the creator of these graphics:

Since 1860, the magnetic pole shift has more than doubled every 50 years…During the past 10 years, the magnetic north pole has shifted nearly half of the total distance of the past 50 years!

Here’s another way to look at the accelerated movement:

MagneticPoleShiftHistory

Where is the pole heading? In the direction of Siberia. All this is not woo-woo information, airports that paint magnetic compass readings on their runways are having to repaint those number every several years.

What’s happening is that, depending on where you are, a compass reading can change by one degree every five years.

The magnetic South Pole is doing the same type of movement away from the geographic South Pole, having moved off the land mass of Antarctica years ago.

Most simplified graphics of the Earth’s magnetic field look something like this:

Earth_geomag

So the question is: Is weather moving with the movement of the magnetic poles? Another way to frame the question: At the magnetic poles, the Earth’s magnetic field captures charged particles flowing from the Sun on the solar wind and directs them toward the surface, an effect visible in the extreme northern and southern latitudes as the Aurora Borealis and Aurora Australis. Is the same energetic pattern also delivering the coldness of space to the planet’s surface? Or is it the relative thinness of the magnetosphere at the magnetic poles?

Well, if it’s correct that this coldness is moving with the magnetic poles, why should anyone care? Because if substantial coldness is moving away from the traditional locations of the geographic poles in Arctic and the Antarctic, then it would seem that the ice at the geographic poles would melt far more quickly than most would expect before equivalent new formations of ice could develop, particularly in the South Pacific where there is no landmass nearby. Perhaps I am uninformed, but I have not heard that such an effect is being accounted for in anyone’s climate change model. And as shown at the beginning of this post, the movement of heat north through North America from the south is proceeding rapidly. If this continues, or more likely accelerates, there might be a whole lot more melting of polar ice caps than previously expected, raising sea levels faster than almost anyone anticipates.

And perhaps my effort above was feeble, but there is a lot of evidence out there for this weather shift. So why are so few talking about it? Clearly, because it doesn’t fit people’s models of how things work. Magnetic pole movement is straight out of conventional science, while the idea that it would impact the weather is not. The solution for most? Ignore the evidence.

What is the Transition? Part 3 is here.

What is the Transition? Part 1

I have made reference to “the Transition.” Before trying to describe its essence, it will be useful to first review aspects of the Transition, in other words, some of its identifiable characteristics. One aspect that runs through all of the others is acceleration, as you will see.

EARTH CHANGES

EARTHQUAKES

Below is a chart of how much shaking the planet has experienced from strong earthquakes for the last 30 years. This chart sums up the Richter values for all earthquakes of magnitude 6.0 or greater for each year. The earthquakes are summed rather than simply counted so that larger earthquakes have slightly greater weight on the chart. To show the trend, the column for each year shows the 10-year average of all that shaking. The trend is unmistakable—things started to really scale up in the early 1990’s:

EarthquakeTrend

The data for this chart was assembled from a straightforward query of the USGS (US Geological Survey) database at their Global Earthquake Search page.

After the massive Japan earthquake and aftershocks of 2011 (it is worth watching this video graphical display of the world’s 2011 earthquakes, especially if you live in the Ring of Fire), there were fewer earthquakes in 2012. However, 2013 is off to a very fast start, as shown in part in this link from Feb 2:

Earth reeling from eight major earthquakes striking in 5 days

And since that post on Feb 2, there have been an 8.0, a 7.0, a 6.4, and a 6.3 in the Solomon Islands, a 6.9 in Japan, and a 6.9 in Columbia.

TSUNAMIS

Earth doesn’t typically see a lot of large tsunamis, but their occurrence has ramped up fivefold in recent years. According to data at the NOAA Global Historical Tsunami Database, which has records going back to 2000 BC, there have been 34 tsunamis with a wave height greater than twenty feet over the last 400 years. Six of those, or 18%, have occurred since the year 2000:

Year Location Water Height Deaths
2000 GREENLAND 50.0
2004 INDONESIA 50.9   226,898
2006 INDONESIA 20.9         802
2009 SAMOA 22.4         192
2010 CHILE 29.0         156
2011 JAPAN 38.9    15,854

In the Twentieth Century, there was a tsunami with a twenty foot wave height about once every ten years. In this century, it has happened once every two years, resulting in the deaths of a quarter million people despite the fact that none of these tsunamis struck a major city. The NOAA’s database shows that even a tsunami less than five feet in height can kill thousands. With 23% of the world’s people living in what is called the “near coastal zone,” tsunamis are likely the single most life-threatening Earth-change phenomenon on the planet.

VOLCANISM

Due to the great behavioral variations of active volcanoes, the tracking of volcanism is not as mathematically rigorous as that for earthquakes and tsunamis. There is a site jointly sponsored by the Smithsonian and the USGS that reports on volcanic activity in the latest week. Here is their list for the week of 30 January–5 February 2013:

New Activity/Unrest:

  • Colima, México
  • Etna, Sicily (Italy)
  • Paluweh, Lesser Sunda Islands (Indonesia)
  • Rabaul, New Britain
  • Reventador, Ecuador
  • White Island, New Zealand

Ongoing Activity:

  • Batu Tara, Komba Island (Indonesia)
  • Chirpoi, Kuril Islands (Russia)
  • Copahue, Central Chile-Argentina border
  • Karymsky, Eastern Kamchatka (Russia)
  • Kilauea, Hawaii (USA)
  • Kizimen, Eastern Kamchatka (Russia)
  • Lokon-Empung, Sulawesi
  • Sakura-jima, Kyushu
  • Santa María, Guatemala
  • Shiveluch, Central Kamchatka (Russia)
  • Tolbachik, Central Kamchatka (Russia)

So, their list is all from the Pacific Rim and Italy. According to some who track this carefully, after a total of 77 volcanic eruptive events for all of the year 2012, there were 44 volcanic eruptive events recorded just in the month of January 2013.

Here are some volcano-related headlines shown on the SOTT.NET Earth Changes page in just the last couple of weeks:

The Great Awakening? Ten volcanoes awaken in one week

Indonesia’s Mount Lokon volcano shaken by double eruptions

Puyehue-Cordon Caulle volcano erupts in Chile

Tavurvur volcano erupts in Papua New Guinea, ash cloud diverts flights

Hawaii’s Mount Kilauea lava lake hits new record high

Manam volcano (Papua New Guinea): Large explosive eruption sending ash plume to 45,000 ft altitude

Campi Flegrei supervolcano raising anxiety among Italian residents

WEATHER EXTREMES (Storms, Floods, Heat Waves, etc.)

Does anyone on the planet need to be told that storms are ramping up in size, intensity, and frequency, resulting in unprecedented flooding? And that heat waves have taken on new intensities and duration? Is there anyone still claiming, “It’s just the internet, nothing has changed, we just have better reporting.”? Anyone making such claims would be well-advised to review the recent history of the global insurance industry. The venerable Lloyd’s of London almost went bankrupt in the mid-1990’s after 350 years of annual profits. They said they had to completely revamp their weather catastrophe calculations because the actuarial data on which they had relied for 300 years (!) was no longer applicable.

Below are some quotes from September 2010 on the web site of Munich Reinsurance, the largest re-insurance company in the world.  Reinsurers sell insurance to other insurance companies to cover catastrophic losses:

Munich Re’s natural catastrophe database, the most comprehensive of its kind in the world, shows a marked increase in the number of weather-related events. For instance, globally there has been a more than threefold increase in loss-related floods since 1980 and more than double the number of windstorm natural catastrophes…

Prof. Peter Höppe, Head of Munich Re’s Geo Risks Research/Corporate Climate Centre: “It’s as if the weather machine had changed up a gear.”

Heavy rain and flash floods are affecting not only people living close to rivers but also those who live well away from traditionally flood-prone areas.

And then things accelerated further. By October 2012, Munich Re reported that the numbers were even larger. They reported that weather-related loss events in North America had grown fivefold over the past three decades, and that there was “an increase factor of 4 in Asia, 2.5 in Africa, 2 in Europe, and 1.5 in South America.”

There are literally thousands of headlines available to demonstrate this idea further, here are just a few:

Cyclone frequency in Indonesia increases 28-fold since 2002

Global warming – or something much worse? Australia adds new colour to temperature maps

The temperature forecast for next Monday by Australia’s Bureau of Meteorology is so unprecedented – over 52C – that it has had to add a new colour to the top of its scale, a suitably incandescent purple.

Aus_New_Color

Tornado slams into Italian steel plant – video

To give you an idea how rare tornadoes are in Italy, four tornadoes in total were recorded in the 17th, 18th and 19th centuries, three were recorded in the 20th century and four were recorded since 2008 alone, with two of those coming in 2012.

And the damage is not limited to single instances, it is cumulative in many areas, for example, the US East Coast:

Former USGS scientist: Coastal cities are ‘sitting ducks’ for next big storm

“We have left our coasts sitting ducks, and Sandy destroyed these natural protections,” she said.

In the space of a few hours, Sandy blew through the sand dunes that had served as natural protections for communities up and down the Atlantic coast.

“Basically these dunes build up over geologic time, and yet the superstorm wore them down over a couple of days, and it is going to take geologic time again to build them back up,” McNutt said.

For those who are more video oriented, this youtube poster does a good job of grabbing news video of weather extremes and earth changes from around the world each month. These can be useful to watch since they can remind just how quickly, under the tremendous distraction of daily life, we forget what’s been happening:

Extreme Weather Events and Earth Changes DECEMBER 2012

The November installment includes Superstorm Sandy. Since the news media typically won’t cover a weather story unless there is a body count to report, few are aware that Lower Manhattan in New York City is still seriously impaired, with skyscrapers running from emergency generators on the street because their basements are still flooded.

RISING TIDES – WITH PERPLEXITY THE SEA AND WAVES ROARING NOVEMBER 2012

FIRE AND ICE – EXTREME WEATHER EVENTS AND EARTH CHANGES JANUARY 2013

(While I applaud SOTT.NET and the maker of the youtubes above, fidockave213, for their excellent work at collecting earth change information, I am not aligned with their editorial views.)

Part 2 describes a huge weather shift taking place on the planet that almost no one is talking about!