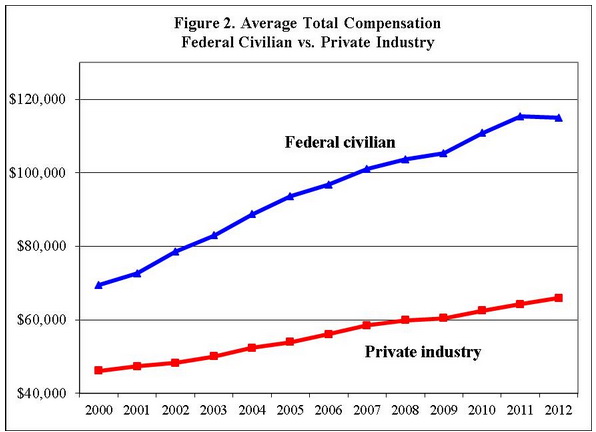
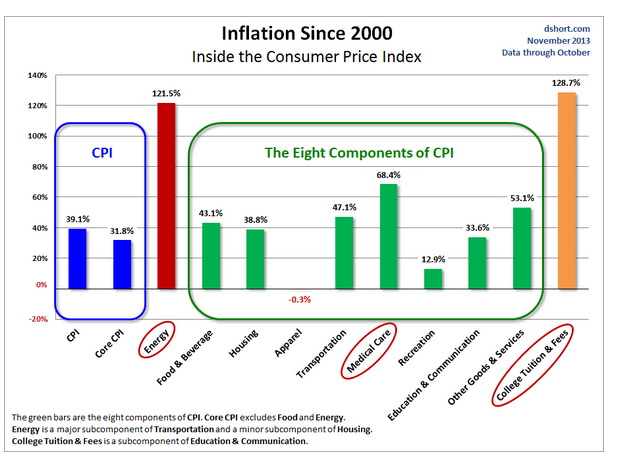
Someone asked me whether I “was still in favor of gold.” The answer is an unqualified Yes. One easy reason is that almost every country on the planet is trying to drive down the value of their paper currency. So if you live in the US, it looks like this, and this is based on the US Government’s statistics for price inflation and we all know that they have every reason to play games to make this number look a lot lower than it really is, so you can safely increase each of these number by 50%:

The first column, CPI, says plenty: That if you live in the US, since the year 2000, the purchasing power of your money, of your salary, has lost 39%. And this is during a period that they claim has had “low inflation”! And the US Federal Reserve is currently on record as saying they are trying to create more inflation. So when you own US Dollars, or items denominated in Dollars such as US stocks and bonds, or items in currencies pegged to the US Dollar, realize that this is only going to get worse. The same is true for the purchasing power of the other currencies.
* * *
The post What’s up with the metals? Part 1 showed that some notable gold bears had turned bullish and that unprecedented demand for physical gold continued. Despite the strong demand, gold then had the bargain price of $1,237 per ounce, having just bounced up from $1,181 on the last day of 2013. Price went to $1,355 Monday and has pulled back to $1,338 today.
The strong demand for physical bullion, coins, and jewelry, documented in Part 1, has continued. Despite record-breaking demand in 2013, Chinese demand year-to-date is 51% higher than demand to this point in 2013. Mints around the world are working overtime:
U.K. Royal Mint Runs Out of Sovereign Gold Coins on Demand
The U.K.’s Royal Mint, which traces its history back more than 1,000 years, ran out of 2014 Sovereign gold coins as prices near a six-month low led to “exceptional demand.”
Gold Mint Runs Overtime in Race to Meet World Coin Demand
Austria’s mint is running 24 hours a day as global mints from the U.S. to Australia report climbing demand for gold coins…
Austria’s Muenze Oesterreich AG mint hired extra employees and added a third eight-hour shift to the day in a bid to keep up with demand. Purchases of bullion coins at Australia’s Perth Mint rose 20 percent this year through Jan. 20 from a year earlier. Sales by the U.S. Mint are set for the best month since April, when the metal plunged into a bear market.
Global mints are manufacturing as fast as they can…“The market is very busy,” Lang said. “We can’t meet the demand, even if we work overtime.”
So, if demand for physical gold is so strong, how could there possibly be such a price drop as happened in 2013? The answer is simple really. They have created a paper gold market that is hundreds of times larger than the physical gold market. By larger I mean in terms of the dollar value of trading in these two markets. People trade paper that has more or less of a connection with gold (sometimes none at all), and it is in these large markets that the price of gold is set. Most of the participants in these paper gold markets believe that they could, if they wished, convert these pieces of paper into physical gold, that the pieces of paper are claims on real gold. But in reality, only a tiny fraction of them could succeed in converting their claims into real metal. There just isn’t enough metal to go around.
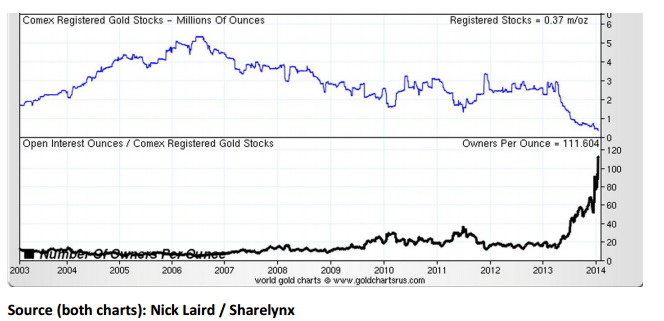
If you think I exaggerate, check this chart, which I’ll explain below. It describes the action at the COMEX, the primary gold price-setting exchange in the US:

The key phrase on the chart is “Owners Per Ounce,” which for the COMEX is now at 111 owners per ounce of gold in the vault! That is, for each ounce of gold in the COMEX vaults (the blue line in the upper section of the chart), 111 contracts exist that allow the owners of those contracts to demand delivery of that single ounce of gold. We all understand that banks operate with only a little cash on hand for all the deposits they’ve taken, called a fractional reserve system. The COMEX is the same, worse actually: percentagewise, they keep a lot less gold around than the banks keep cash on hand.
(Please skip this paragraph if you already understand what 111 owners per ounce means!) Let me explain: The COMEX is a futures trading exchange where people trade gold and other commodities. Futures exchanges were created to be a meeting place between producers of a commodity and its end users. In January of any year, for example, a producer of wheat can agree to sell wheat in the future, in September, at a specified price to a cereal company. Both the wheat farmer and the cereal company know that they can make a reasonable profit on their operations if the farmer supplies, and the cereal maker takes delivery of, wheat at the pre-arranged price when that wheat is ready in September, so they make the deal. That’s called a futures contract. It promises both delivery and payment in the future at set price, and that’s great. But the futures exchanges are now dominated by big money speculators who have no intention of producing or taking delivery of anything. The chart above reflects this reality. The COMEX vault is supposed to have gold to back up the gold trading that takes place on that exchange. As you can see in the upper panel of the chart, back in 2006 they had over 5 million ounces backing up the contracts. Now that amount has fallen by 93% to only 370,000 ounces as more people realize that they better stop trading paper and get their hands on the real stuff. Currently, for all the futures contracts to buy and sell gold on the exchange, they only have 1 ounce for every 111 contracts in existence. These contracts are paper gold, a huge synthetic supply of fake gold. If everyone decided to make their claim for real gold (similar to a run on bank), only 1 ounce would be available for every 111 claims. Such an attempt would drive the price of physical gold into the stratosphere. On a typical day last week, 55,000 of these paper contracts traded hands. That represents 5,500,000 ounces of paper gold traded each day just at the COMEX. That trading sets the price for gold in the US. But it’s possible that no one demanded delivery of gold from the COMEX on that same day. So the trading that sets the price is really for cash, not for gold. And this paper trading involves a lot of borrowing, that is, leverage. One can easily prove this crazy situation by contacting a futures broker and creating an account with $8,000 in that account. One could then buy or sell (they call it selling short) a futures contract for 100 ounces of gold. At today’s price of $1,338 per ounce, 100 ounces of gold is worth $133,800. So as far as COMEX is concerned, you are using your $8,000 gambling stake to control $133,800 worth of gold. And this “gold” can be sold, driving down the price. Seems crazy, but it’s literally true.
So if you or I can control 100 ounces for $8,000, imagine what JP Morgan and Goldman Sachs can control with the many billions of printed money they receive from the Federal Reserve, printed money that has not been lent out to boost the economy but is being used as collateral for trading. They can push markets in whatever direction they want. The same is true for central banks, but on an even greater scale: They have no limit on the amount of cash they can print up, so they can overwhelm any market anytime they wish.
The COMEX sets the price in the US. In London, it’s the LBMA (London Bullion Market Association) which is more than 7 times larger than the COMEX in terms of the dollar value of daily paper gold trading. The LBMA admitted a couple of years ago that, like the COMEX today, their leverage ratio was over 100 to 1. And the gold market in Switzerland is just as large as the LBMA, but it is run privately by the Swiss banks, so they publish no statistics. All told there are 40 futures exchanges in the world for trading paper gold.
Another form of paper gold is certificates for gold accounts with banks. Several of these banks have been caught charging people fees for storing gold when they are actually storing nothing at all. The banks figured they could quickly meet any claims for the gold, but when the claims came in, it took them weeks to procure the gold in the open market.
And there are stocks that hold gold, options on both those stocks and on the futures described above, gold leases, and swaps contracts. The latter are private contracts and they may actually dwarf all of the rest of the paper gold claims in terms of their stated dollar value (their “notional value,” as it is called) because the central banks, like the US Federal Reserve and the Bank for International Settlements, often use swaps for their trading. What, central banks trading gold? In September, the French Central Bank admitted:
We are still active in the gold market for our own account…meaning that we are in the market nearly on a daily basis.
In that same paper, the Bank of France said they owned 2,500 tons of physical gold and that they had no plans to sell it. So what are they trading daily? Paper gold, for profit.
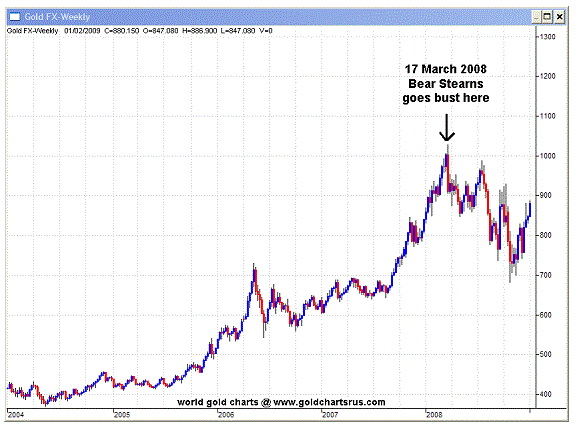
Sometimes people go way too far with these contracts. People thought that Bear Stearns went bankrupt in 2008 because of the mortgage market. But the astute article What Really Happened to Bear Stearns by Ted Butler explains that it was actually bad trading in gold and silver that took them down: they had massive bets that the prices of gold and silver would go down, but instead the prices shot up by a lot over a few months instead.

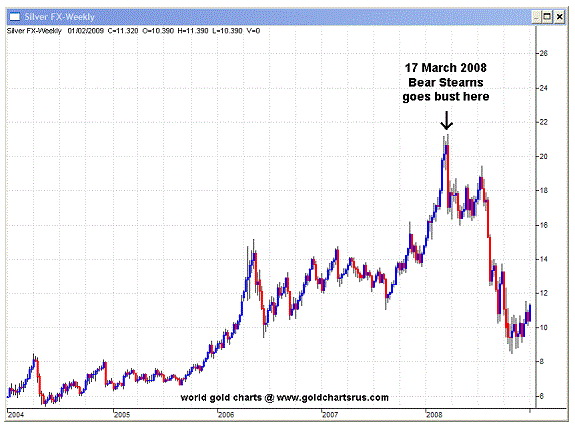
The chart above is the price of gold from 2004-2008. Notice how the price was moving up strongly prior to the collapse of Bear Stearns. Guess who picked up all of the assets and trading positions of Bear Stearns as it went bankrupt. Why our “good friends” at the company implicated in, and fined for, manipulating just about every market around since then: JP Morgan. They picked up Bear’s assets for about 6 cents on the dollar. Notice the smashdown of the gold price as soon as Morgan was in charge. The price smashdown was even worse in silver. Here’s the chart from 2004-2008 for silver:

It sure makes one wonder whether JP Morgan was involved in both moving the price up to bankrupt Bear Stearns, and then smashing it down once they had taken over Bear and inherited all those bets that the prices of gold and silver would drop.
Getting back to our discussion. All of these contracts taken together are called derivatives because they derive their value from the underlying value of gold. Guess who owns most of them now:
Market Cornered: JPMorgan Owns Over 60% Notional Of All Gold Derivatives
What? Isn’t it illegal to corner a market? Don’t the regulators come down hard on anyone trying to corner a market? Yes, but as long as it isn’t gold or silver. JP Morgan is allowed to corner gold and silver because it serves the interests of those who still want the US Dollar to dominate the world so that the US can continue to exercise its “exorbitant privilege” of printing paper to trade for the real goods of other countries. So if someone like Morgan and the central banks weren’t suppressing the prices of gold and silver, it would make the Dollar and the other paper currencies look bad, and those in charge won’t allow that.
To show you how off base these government people and economists are, when Nixon took the world off of what remained of the gold standard in 1971, his chief economist was the “great” Milton Friedman. Friedman told Nixon and others that gold was deriving its value from the US Dollar, not the other way around, and that as soon as Nixon severed the link between gold and the Dollar, that the price of gold would actually fall quite a lot. He was entirely wrong, as government economists so often are, as gold never looked back again at its then-current price of $35 per ounce.
These government types have always hated gold for one reason: it inhibits their ability to wage war. We’ve covered it before: governments started going off the very-successful gold and silver standards in order to fight World War 1. That war would have been over in a few months, but that wasn’t good enough for the warmongers, they had to kill off millions of people over four years to serve their greed.
We’ll talk more about governments and gold later, including their failed attempts to suppress gold in the past, in Part 3. But you know that comment above about the gold price going into the stratosphere when people with all these paper contracts rush to convert them to physical gold? That will happen. It’s inevitable, as more and more people lose confidence in governments, banks, and the blizzard of paper claims they have created. That COMEX chart above–where it shows that the physical gold backing up the paper trading is down by 93%–says that the process is already well underway. Best to get your gold and silver before all those folks with the paper contracts try to get some because, at that point, it will be tough to find real gold at any price.