Excellent videos on recent Earth changes

If you find Thundering Heard at all interesting, you owe it to yourself to see this video, either on youtube:

     SOTT Earth Changes Summary – July 2014

or on vimeo. It’s a truly remarkable video summary of events on our planet during July.

And if you found that interesting, here are the summaries from the prior two months:

     SOTT Earth Changes Summary – June 2014

     SOTT Earth Changes Summary – May 2014

For those who can’t access youtube, here are links for those same June and May videos on vimeo.

SOTT.NET is doing a great job on these videos.


Lightning, and the Earth’s weakening magnetic field

Why lightning? Because, in articles found since July 1:

     Lightning Strikes 14 People In California

     Ball of lightning hospitalises woman and kills hundreds of pigs at farm in China

     Single lightning strike kills 45 head of Black Angus cattle on Montana ranch

     In Bashkortostan, lightning killed 101 sheep

     Two reports of lightning going inside homes and striking people down

     Family of four struck by one lightning bolt

     Second lightning strike fatality in two days at Colorado park, officials say

Four people were injured in Saturday’s strike, and eight were hurt on Friday, officials said in a news release.

For those interested, more headlines about increasingly fierce lightning since July 1 are at the bottom of this post.

From the Manifesto for this site:

This transition is not limited to things human. It reverberates through our entire energetic continuum: the Earth itself is having documented increases in earthquakes, volcanic eruptions, changing weather patterns, and extreme weather events; energy is dancing from the Sun as we’ve never seen before; even the Earth’s magnetic poles are on the move in accelerating fashion.

This is yet another manifestation of the full-spectrum energetic change we are beginning to experience. Yes, lighting strikes occur millions of times a day across the planet. But in recent months, the power of some of these strikes has clearly escalated. Single bolts are striking multiple people and are able to kill a hundred animals at a time. This is not usual.

The cause? It could be from the general increase in the power of storms documented here in several past posts. But it could also be related to this, based on the latest readings from the European Space Agency’s (ESA) satellite array called Swarm:

     Earth’s Magnetic Field Is Weakening 10 Times Faster Now

Once every few hundred thousand years the magnetic poles flip so that a compass would point south instead of north. While changes in magnetic field strength are part of this normal flipping cycle, data from Swarm have shown the field is starting to weaken faster than in the past. Previously, researchers estimated the field was weakening about 5 percent per century, but the new data revealed the field is actually weakening at 5 percent per decade, or 10 times faster than thought. As such, rather than the full flip occurring in about 2,000 years, as was predicted, the new data suggest it could happen sooner…

Earth’s magnetic field acts like a giant invisible bubble that shields the planet from the dangerous cosmic radiation spewing from the sun in the form of solar winds.

So, yet another example of acceleration and energetic change. When one combines this with the idea of an electric universe–that is, one in which electricity is present everywhere, a view that is being proven by excellent work summarized at sites like the Thunderbolts Project–then as the magnetic field weakens, our environment is being stimulated in an increasing way by the emanations of the Sun. Researches such as Mitch Battros have for years been showing an extremely high correlation between geomagnetic storms that hit the Earth and an increase in earthquakes and storms in the 24 to 72 hours that follow, as he did again this weekend at his Earth Changes Media web site:

BREAKING NEWS: Friday’s Two M-Class Flares Accelerate Ocean and Jet Stream Currents

On August 1st, two M-class flares fired off from sunspot regions 2130 and 2127, both of which were located at the Sun’s central meridian producing direct hits to Earth.

Within 24 to 48 hours of these solar storms, four tropical storms; Genevieve, Bertha, Halong, Iselle – were either produced or elevated. Within an additional 24 hours, the NOAA Tsunami Warning Center a 7.2 magnitude earthquake hit near Lorengau, Papua New Guinea at 00:22:03 UTC, August 3rd 2014.

He could haven mentioned these earthquakes as well:

     Update: At least 367 killed in southern China after strong earthquake

     USGS: Earthquake Magnitude 6.1 – Federated States of Micronesia region

So, what’s the moral of the story?

1. If you are in the vicinity of a lightning storm, don’t mess with it. Ignoring the storm based on thoughts of the low probability of being struck by lightning may no longer be a wise approach.

2. Expect further acceleration in the trends documented at Thundering Heard: extreme weather, earthquakes, magnetic pole migration, and so forth, and take whatever measures, if any, you deem appropriate.

3. Expect an increasing effect from these energetic changes on society and on you, at all levels of your being.

Here are some additional lighting links gathered since July 1:

     3,400 lightning strikes in Central Oregon – dozens of wildfires erupt

     Spanish World Cup team plane struck by lightning on way back from Brazil

     Colorado man struck by lightning while filming storm

     Severe lightning storms tear through Chicago area

     Lightning knocks Atlanta-area man clean out of his ‘smoking’ boots

     Dramatic film of lightning strikes as July storms hit the UK

     UK storms cause further disruption after lightning

     UK freak lightning & hail plunge commuters into ‘Zombie Apocalypse’

     Spectacular lightning strike filmed in New York

     Lightning storm creates terrifying nuclear bomb-style mushroom cloud above Sardinia

     ‘Whistling’ Volcanic Lightning Heard Halfway Around the World


Unstable

Instability is accelerating in many spheres of life on Earth.

Earthquakes have accelerated beyond the record-setting pace described in Rockin’ and Rollin’ with sixteen magnitude 6.0 quakes in the first sixteen days of May. So we’re running at the rate of one major quake per day. Here’s the list:

Date/Time Magnitude Place
2014-05-16T11:01:42 6 113km NE of Grande Anse, Guadeloupe
2014-05-15T10:16:41 6.2 50km WSW of Alim, Philippines
2014-05-15T08:16:34 6.6 96km SSE of Ifalik, Micronesia
2014-05-14T20:56:13 6.1 99km SSE of Ifalik, Micronesia
2014-05-13T06:35:24 6.5 108km SSE of Punta de Burica, Panama
2014-05-12T18:38:37 6.5 Southern East Pacific Rise
2014-05-10T07:36:01 6 11km W of Tecpan de Galeana, Mexico
2014-05-08T17:00:17 6.4 15km N of Tecpan de Galeana, Mexico
2014-05-07T04:20:33 6.1 96km SW of Panguna, Papua New Guinea
2014-05-06T20:52:26 6.1 West Chile Rise
2014-05-05T11:08:43 6 9km S of Mae Lao, Thailand
2014-05-04T20:18:24 6 23km ESE of Ito, Japan
2014-05-04T09:25:14 6.1 South of the Fiji Islands
2014-05-04T09:15:53 6.6 South of the Fiji Islands
2014-05-02T08:43:37 6 70km SSE of Namlea, Indonesia
2014-05-01T06:36:35 6.6 201km WNW of Ile Hunter, New Caledonia

And Oklahoma, famous for tornadoes but hardly for quakes, has seen an incredible increase in earthquakes with a magnitude of 3.0 or greater, from about two per year from 1975-2008, to forty per year in recent years:

     What’s causing the huge spike in earthquakes in Oklahoma?

The US Geological Survey found that from 1975 to 2008, central Oklahoma experienced one to three 3.0-magnitude earthquakes a year, compared with an average of forty per year from 2009 to 2013. And it looks like that number is going to get bigger. It’s only February, and the state has already logged more than twenty-five quakes of 3.0-magnitude or larger this year, and more than 150 total quakes in the past week alone.

This instability isn’t just in the Earth’s crust. Check these real estate statistics that came out of China late last week:

  • 1st-tier cities sales fall 40% y/y (year over year)
  • 2nd-tier cities sales drop 65% y/y
  • 3rd-tier and 4th-tier cities sales decline 32% y/y

In a country where real estate development has played an outsized role in their long economic boom–and on a planet where Chinese economic growth has contributed greatly to the world not sliding off into total Depression–these dropoffs are shocking. The Chinese government has been well aware that they have a real estate bubble, and they’ve been trying to deflate it gradually, but those numbers don’t quite equate with “gradual.” Their solution to bring things back to life? What else? No money down!

     In China Homes Are Offered “Zero Money Down”

Since March, 20 property developers in Guangzhou have been offering “zero down-­payments” to attract buyers, in addition to large discounts and tax refund, the National Business Daily reported Monday.

I’m sure that will work out real well.

How big is the China real estate bubble? It turns out someone at a private business meeting surreptitiously recorded the comments on this very topic by the vice-chairman of China’s biggest property developer. He describes Chinese real estate as an epic bubble:

“In 1990, Tokyo’s total land value accounts for 63.3pc of US GDP, while Hong Kong reached 66.3pc in 1997. Now, the total land value in Beijing is 61.6pc of US GDP, a dangerous level,” said Mr Mao.

“Mr Mao said China’s house production per 1,000 head of population reached 35 in 2011. The figure is below 12 in most developed economies “even when the housing market is hot; no country has a figure of greater than 14”.

The Chinese have been so enamored of real estate that they’ve been buying lots of it in California as well:

Cash buyers reach record level of all home purchases at over 42 percent: 80 percent of all sales over past year in Irvine went to buyers from China?

In California, Chinese nationals and immigrants are “parking their cash in single-family homes,” said Meyers.

In Irvine, Calif., for example, 80% of sales over the past year were to Chinese buyers, he said.”

This is a massive amount of targeted home purchasing in one city. I’ve had a few contacts that sell homes in the Orange County market telling me that 7 out of 10 purchases were going to Chinese buyers, all with cash offers…Irvine is no small city with 230,000+ people living in the city.

These frenzies always work out so well in the long term. Sure. (Do I even need to say it to anyone considering buying residential real estate in California, where bidders now present PowerPoint presentations about their offers to the owners? Be careful out there!!!)

And speaking of China and instability, Japan and China have been rattling the war sabers, but most aren’t aware that they are in a no-holds-barred currency war, with each country struggling to take down the value of its own currency to try to make their exports cheaper in world markets. Currency wars don’t generally end well.

And China has territorial disputes not only with Japan, but with Viet Nam and the Philippines as well. We’ll cover those in a separate post on how the War Cycle is progressing.

And what about instability in the banking system. So far this year there have been sixteen high-profile banker deaths: murders by angry customers, suicides, and mystery deaths. By mystery deaths I mean deaths under very suspicious circumstances where the deceased gave no indication at all of wanting to commit suicide, for example, sending an e-mail to a spouse arranging that night’s dinner plans–just an hour before they jump out of a 30th floor window? Some of these people were involved in government investigations of their activities and so they may have known more than their employers wanted them to divulge. Or perhaps these employers–it turns out that the four largest US banks hold $680 Billion in life insurance on their individual employees–simply want to collect on some insurance policies. And trying to find out about this doesn’t work because the US regulators are calling this a “trade secret” of each of the banks:

     Suspicious Deaths Of Bankers Are Now Classified As “Trade Secrets” By Federal Regulator

Well, if anyone wants to verify any of this–though I don’t recommend it–here is a starting point:

     52 Year-Old French Banker Jumps To Her Death In Paris (After Questioning Her Superiors)

And here is the strange story of a guy who worked for the US Federal Reserve for 26 years threatening his boss, the head of a major US housing agency, with murder, apparently over a bad job review the boss gave him!?!

     Former San Fran Fed Employee Threatened To Murder Ex-FHFA Head Ed DeMarco

Stranger still is that the guy was easily released on bail.

So people seem just a bit testy in the banking and finance world. The question for the rest of us is: how much of our savings do we want in these people’s hands? You know my vote.

Instability has unexpected consequences. Some countries, such as Pakistan, are now so unstable that polio is making a comeback:

In February, the WHO found that polio had also returned to Iraq, where it spread from neighboring Syria. It is also circulating in Afghanistan (where it spread from Pakistan) and Equatorial Guinea (from neighboring Cameroon) as well as Nigeria, Ethiopia, Somalia and Kenya.

I guess those countries are on the Who’s Who list of instability.

This post could go on and on, but I’ll end with a high-quality video showing some of the earth changes and extreme weather in April:

     Signs Of Change The Past Month Or So 2014 (4) April/May


Earth changes statistical update

Just over a year ago, the post What is the Transition? Part 1 presented statistics and charts showing that there is an acceleration in extreme weather events and geologic changes. And there have been several posts with specifics, including these:

     The Weather Gets Even Wilder

     Weather Wildness Update

     Britain faces choice of saving town or country from floods

This is a statistical update showing that this exceedingly important trend continues.

For starters, here is a chart from the world of yet another industry whose original intent–a way to spread financial risk that could overwhelm an individual to a wider community–has been perverted to massive investment pools from which any payment is not celebrated as a victory but is called a loss. Thus the chart of “Loss events worldwide 1980-2013” from the largest re-insurance company in the world, Munich Re. I use it so that any reader who might still be mired in “it’s just better reporting because of the internet” delusion about accelerating Earth changes–I heard of a person who still claimed that recently, so there must be more–can put that aside. So, not from the woo-woo world, but from the Mr. Gradgrind hard-nosed no-nonsense actuary-driven world where all things are calculated in currency and where the business model depends in great part on frightening people into buying more insurance than they need:

MunichReWeatherAndEarthChangesLines2wTextI added the cone lines highlighting the expansion of damaging floods (the blue portion of each bar) and storms (the green portion) from around 250 per year in the 1980s to around 700 per year for the last eight years. That’s a mighty clear indication of trend as opposed to outlier.

The chart does not show all damaging floods and storms, just those that caused losses for the insurance industry. The chart shows a similar acceleration in damages from “extreme temperature, drought, forest fire” (the yellow part of each bar).

It shows a fairly constant set of losses from geologic events, but this chart does not tell the true story of geologic events because, worldwide, very few have earthquake or volcanic eruption insurance, so there are relatively few loss events from these for the insurance industry.

According to those who closely monitor volcanic eruptions, these set a new all time record in 2013, with 84 volcanoes erupting, beating the previous record of 82 in 2010. There were even volcanic eruption clusters:

     Seven Volcanoes In Six Different Countries All Start Erupting Within Hours Of Each Other

And then there was this “minor problem”:

     Scientists find new volcano rumbling under Antarctica ice: 1,370 tremors: “It may blow or it may not. We don’t know.”

And with 32 volcanoes having already erupted this year, 2014 is off to a thundering and deadly start. After this in Indonesia:

     Villagers run for their lives as Sinabung volcano kills 16 in Indonesia

there was this from the Jakarta Post:

     19 more volcanoes on alert

Jakartavolcanoefeb4.img_assist_custom-560x306

     Electric universe: Pyroclastic flow from Sinabung volcanic eruption last month produced string of ‘tornados’

Here is a video link to those tornadoes.

If I had all the data to chart volcanic eruptions, it would likely look very much like this chart of the 10-year average of earthquakes of magnitude 6.0 or greater, updated with 2013 data:

EarthquakesMag6_2013

These days, the planet has one of these potentially damaging earthquakes on average every two and a half days, though more typically they come in clusters as well:

     Global outbreak of strong earthquakes on anniversary 9.0 Fukushima earthquake

quake_map

There were no significant tsunamis in 2013, so my previous comment from the end of 2012 still seems appropriate:

According to data at the NOAA Global Historical Tsunami Database, which has records going back to 2000 BC, there have been 34 tsunamis with a wave height greater than twenty feet over the last 400 years. Six of those, or 18%, have occurred since the year 2000…In the Twentieth Century, there was a tsunami with a twenty foot wave height about once every ten years. In this century, it has happened once every two years, resulting in the deaths of a quarter million people despite the fact that none of these tsunamis struck a major city.

Sinkholes have continued unabated, though in the rain-drenched UK, there have been multiple large land movements:

     Huge cracks appear in Jurassic Coast a third of a mile inland after landslide in UK

UKarticle_2570052_1BE7D39F000005

And given that the world saw a very strange outbreak of mid-Winter brush and forest fires:

     Despite hurricane and record flooding, fire crews dealing with large bog fire near Aberystwyth, Wales

     Winter wildfire weirdness continues: Firefighters tackle 100-acre grass fire near Shawnee, Oklahoma

     Wildfire in western Broward burns 350 acres, Florida

     Are ‘drought conditions’ really to blame for winter wildfire outbreak across U.S.? Wildfire breaks out in Florida marshland‏

     Another wildfire in Norway: Fire on Norwegian coast destroys 140 buildings

     Fire devours historic Norwegian village, 90 people hospitalized

     Many Tibetan monasteries and famous sites destroyed this winter by mysterious ‘wildfires’

     Take cover! Meteor fireballs rain down across U.S. – Outbreaks of wildfires reported

it seems I would be remiss in not mentioning that meteor fireball sightings have been increasing dramatically in recent years. Confirmed sightings doubled from 2011 to 2013:

FireballsEnglish_Version_2014_6

Do I report all this to frighten? Not at all. I report it because it is the reality in which we are living; because I have learned the hard way that standing firm in the face of nasty powerful trends is very high risk behavior and usually turns out poorly; and because I want those who read Thundering Heard–who are presumably open to the idea that the accelerating changes we are seeing in most fields of life are related and are very important for humanity and for each of us–to stay alive so that, after the collapse of the financial system, they are ready to help rebuild society based on principles that include wisdom, creative intelligence, and compassion rather than the rampant and self-defeating materialism that is disintegrating our precarious “civilization.” (The quotes around civilization refer to Gandhi’s remark: “What do I think of Western civilization? I think it would be a very good idea.”)

So as I say to my younger cats when they bound out the door at night to face the local wildlife: Be careful out there.

“Britain faces choice of saving town or country from floods”

That title is a quote from the chairman of the UK Environment Agency informing people that there is no way the country has the money to save–that is, build flood defenses for–both city and rural areas:

     Britain faces choice of saving town or country from floods, says agency chief

What’s happening in Britain is a perfect example of what people in an increasing number of regions are facing: a relentless parade of major, deadly storms. Decades back, England was William Blake’s “green and pleasant land,” celebrated for its mild weather with the occasional major storm. Now it’s a rare week that doesn’t have 100mph winds strafing some part of the British Isles. Here’s a bit of high surf in Wales:

UK124826

(Photo source: Huge waves smash into British coastline, swells up to 75 feet recorded off-shore, UK government considers establishing tsunami-warning system)

And a lighthouse in Cornwall:

Cornwallarticle_2554557_1B4C531B000005

(Photo source: UK storms: While some FLY in 80 mph winds, others wade through murky water to salvage what little they have left (amazing photos) )

Even where houses are not on coasts or in flood plains, 1.6 million homes are said to be at risk of flooding from the water table rising.

From the BBC:

     10 key moments of the UK winter storms

And CNN:

     Atlantic storm brings more misery to drenched Britain: heaviest rainfall in 250 years

     UK government sends 5,000 military personnel to flood zones as hurricanes keeping coming

Somerset1622103_214327935429018_188120

(Photo source: UK Floods Could Last Months, Scientist Warns  )

*  *  *

Food For Thought

The bigger question is whether the UK Environment Agency will be able to save town or country. In my view, they won’t have the time or money to save either. How often do people have to hear about unprecedented winds, rain, and waves–storms that almost everyone now realizes are ramping up in intensity, not receding–before they move away from coasts, flood plains, and low-lying areas? Perhaps some few will move to high ground, but it’s almost certain that most will not. Most, even faced with complete destruction of their homes, show a Monty Pythonesque “bravado and derring-do” and vow to rebuild on the same spot, egged on by clueless newscasters and politicians. As someone who studies cycles, I conclude that, if every culture on the planet has, in their oral and written traditions, reports of floods that totally cleanse the land, there is a reason. And it isn’t because there was one really big worldwide flood. It’s that cyclically, repeatedly, the Earth’s surface gets an intensive cleansing. From the way we are treating the planet, isn’t it obvious why? If the Earth didn’t do this cyclic cleansing of its own surface, would there be any humans here at all? As I said: food for thought. I know many will reject such thinking. All I am suggesting is that eyes and minds be kept open to the steadily emerging evidence.

For example, the British storms have swept away the sand from many beaches. Here’s a story that the storms uncovered human footprints from 800,000 years ago. If that’s correct, then we could be talking about lots of cycles:

     Ancient footprints dating back 800,000 years found in Norfolk


The Weather Gets Even Wilder

Just days after the Weather Wildness Update comes deadly Typhoon Haiyan. Some say it is the most powerful storm to make landfall in modern times:

Philippines storm leaves estimated 10,000 dead, destruction hampers rescue efforts

Mainstream headlines published as the storm was hitting the Philippine coast claimed that the storm would not be devastating. But it’s tough for them to say “Nothing to see here, move along” when thousands die.

The amazing Ageless Wisdom Foundation, based in Manila, is already in the field, organizing relief efforts. With the Philippines on the front line of earth changes, they are becoming veterans of dealing with emergencies. They add this to their usual work: ever-honing their formidable attention through their individual multi-decade meditation practices and esoteric studies; building their own retreat center; giving telepathic healings around the world that are so powerful that if you are in the room when they are addressing a person in need in that room, you can feel the entire room heat up, even half a planet away; working in the poorest sections of Manila; the list goes on. And that’s all in addition to their people each working to make a living. They quietly change lives for the better, a beacon to us all for how to be a human during this Transition.

Weather Wildness Update

A few days ago, just a single year after Superstorm Sandy, I saw a post in which someone claimed that the weak Atlantic hurricane season meant that the weather wildness posited by the climate change people was a thing of the past. I passed on quickly (and didn’t save the link), figuring that this was either from the global cooling propaganda crowd, or from someone with an incredibly narrow view of the world. People in Mexico (hit by two hurricanes at once), the UK, and the “small” continent of Asia, which has experienced epic flooding this year, would be likely to disagree with that “thing of the past” idea.

Here are two weather wildness aggregator videos made by someone who does not include Bible quotes. Note the mention by a news commentator in the first video of “the 23rd typhoon to hit this year”:

     Signs Of Change The Past Week Or So October 2013 Part 1

     Signs Of Change The Past Week Or So September 2013 Part 2

More cycles

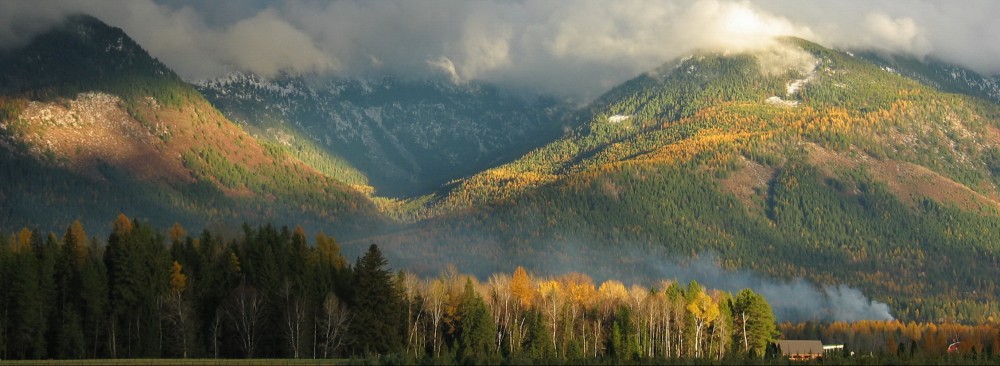
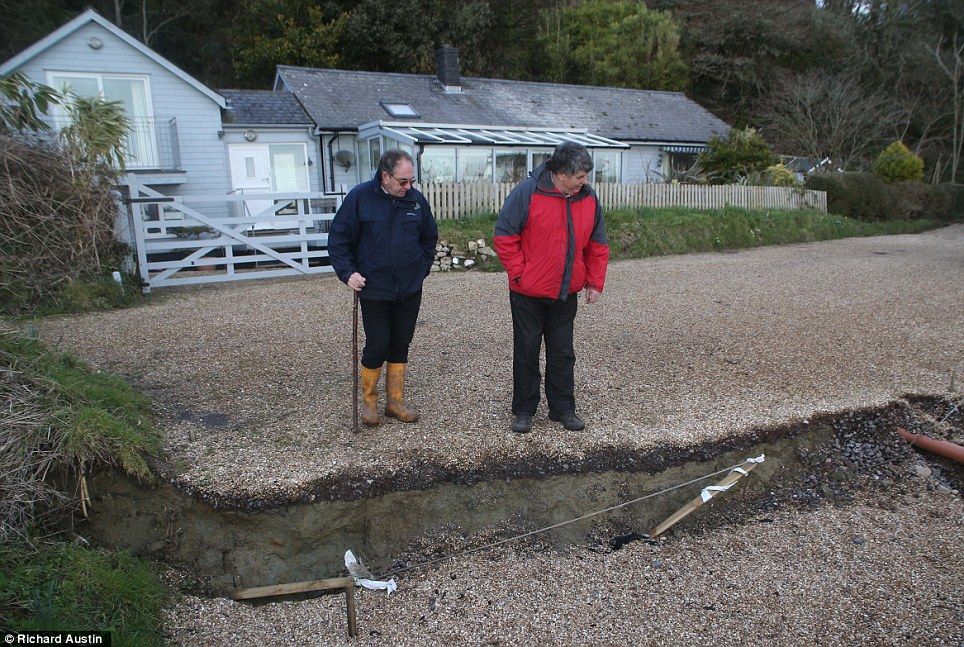
Yet another instance of the accelerating flood cycle: a photo from the devastating Himalayan floods, indicating a stance people might wish to take during these times:

submerged-lord-shiva-idol-in-rishikesh-1

* * *

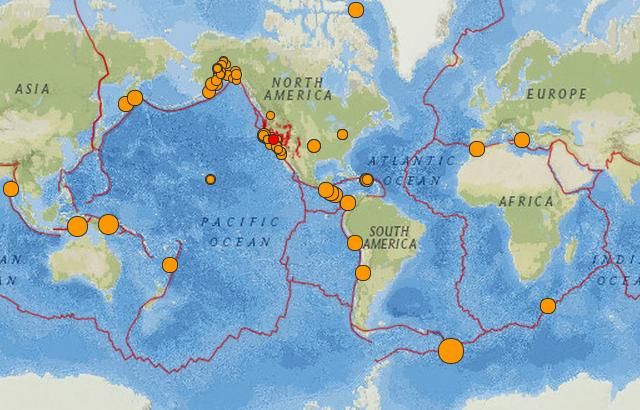
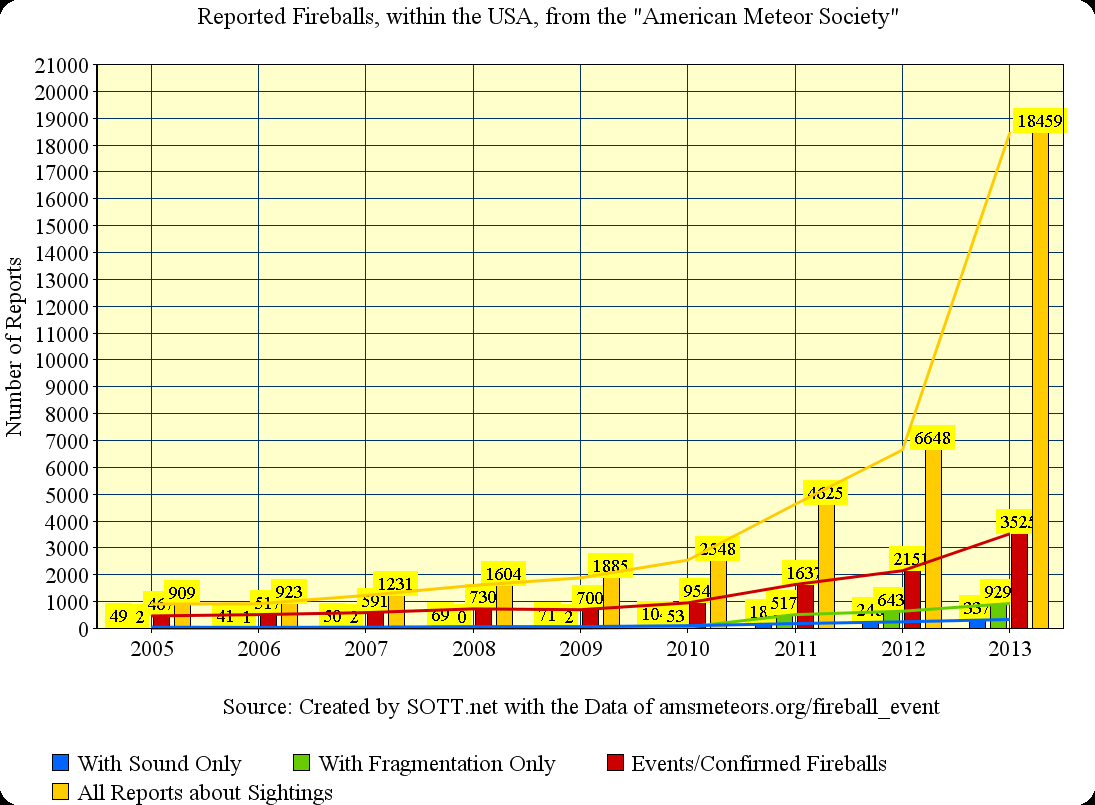
Despite being surrounded by the cyclic nature of physical life (breathing, heartbeat, blinking, day/night, tides, seasons, birth/death … and the less visible or invisible: sound waves, radio waves, x-rays, microwave cooking, evolution … and for a fun contemplation of large astronomical cycles, see this and this), for the most part, people tend to ignore cyclicality in favor of seeing life as a straight-line progression. This is unfortunate for at least two reasons: first, because all form is cyclic—form emerges, flourishes to some extent, and dissolves; second, because there are some not-so-obvious cycles that offer understanding for what is otherwise quite mysterious. In fact, here at Thundering Heard, we are on a path to discuss the biggest cycle of them all for people, a cycle that, once grasped, contains the answers to “little” questions like the meaning of life, why are we here, and so forth. But first, let’s get more adept at seeing the cyclic aspect of life and how important it is.
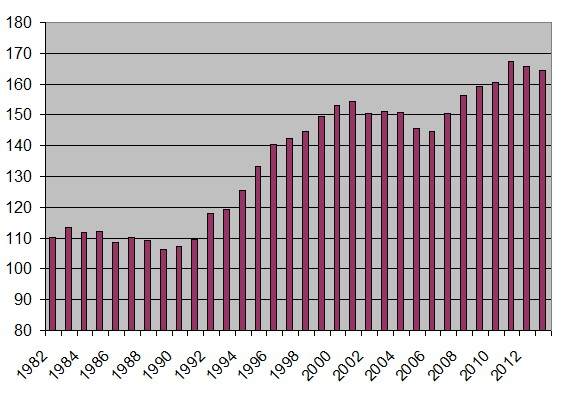
The Sunspot Cycle

There is a peak of sunspot activity every 10 to 13 years, with 11 years being the average for each cycle. A chart of the peaks and troughs of sunspot activity from 1926 to 2009 looks like this:

Sunspots_Longer_Annot3

Let’s look at the three peaks labeled A, B, and C.

The peaks of sunspot activity often really “rev people up” financially, that is, there is typically an excitation of human activity that leads to a financial market bubble that coincides with the sunspot peak.

Three peaks ago, the peak in 1980, labeled A above, coincided with the peak of the commodity price boom and price inflation that took place in the 1970s after Nixon defaulted on the US promise, made near the end of World War 2, to always support conversion of Dollars into gold. Those were the days when the so-called Misery Index (inflation plus the unemployment rate) was tracked in daily newspapers, and mortgage rates in the US rose to 18%.

Here’s a closer look at the last two peaks of sunspot cycle activity:

Sunspots_2_Annot

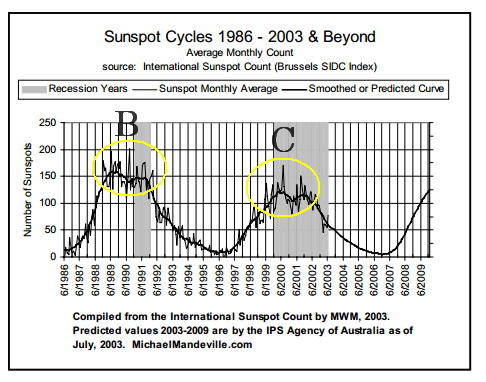
The cycle peak labeled B was in 1990 and corresponded with the peak in Japan of bubbles in their stock and real estate markets. This was the time when it was generally held that Japan Inc. would rule the world, or at least own it; that its economy would soon be the largest in the world. A single block of downtown Tokyo real estate was said to be worth more than all of the real estate in California. Now that’s a bubble! (We’ll see in our next post on cycles why that Japan bubble grew so large when we cover another cycle that also contributed to this Japan peak. When multiple important cycles converge, the results can be gargantuan.) Following that peak, Japan experienced what has come to be called The Lost Decade, though it has now run for two decades. Both their stock and real estate markets lost 75% of their “value” after that peak, and they still have not come anywhere close to recovering their former glory as Japan has been mired in nearly constant recession ever since.

The sunspot peak labeled C aligned with the peak in the internet/technology stocks in the Spring and Summer of 2000, another famous bubble. Again money flowed, this time into Pets.com, Webvan,com, Geocities,com, DrKoop.com, and many others, most of which had little going for them except an idea and a web site. Little or no sales, no profits—who cared! They were going to the moon. It was a New Paradigm. If you thought it was insane, you “just didn’t get it.” And the thing is, that craziness for internet stocks had been in play for a few years; that hoopla could have ended in 1998 or 1999. But it didn’t. It ended when the sunspot cycle peaked in 2000.

Looking back, it would have been great for the participants in those bubbles to be aware of the sunspot cycle peak. They could have sidestepped a lot of trouble. So what’s going to happen this time around? Well, for a few years, I have thought that  this economic cycle might hang on into the peak of the current sunspot cycle, called Solar Cycle 24, which was projected for August 2013. But Amon Ra may have thrown us a curve ball. It looks like this cycle will not have the usual single large peak, but rather a dual peak like Solar Cycle 14 from the early 20th Century. According to solar physicist Dean Pesnell of NASA’s Goddard Space Flight Center:

“This is solar maximum. But it looks different from what we expected because it is double peaked.” Pesnell noted similarities between the current cycle and Solar Cycle 14, which happened between February 1902 and August 1913 and experienced a double peak. If the two cycles are in fact twins, he said that “it would mean one peak in late 2013 and another in 2015.”

Here is a chart that shows the peak in 2000 plus our current cycle:

sunspts_predict_l

If the NASA guy is right, there should be a bubble peak in either 2013 or 2015. But a bubble in what? Here are some clues:

  • Lots of savings accounts pay only 0.01% in interest.
  • Mortgage rates got near 1% in Japan and 3% in the US. (Would you lend money to a stranger for 30 years for 3% interest? Neither would banks, which is why almost all mortgages need a guarantee from a government program or the banks won’t make the loan.)
  • Short-term interest rates in Germany and Switzerland recently went negative. That’s right, if you wanted to lend money to Germany or Switzerland on a short term basis, you had the pay them for the privilege.

If you think these phenomena don’t make a lot of sense, you are right. But it points to the culprit that has all the hallmarks of a monster bubble: the world government bond market. The bull market in bonds has been running for over 30 years. On May 2, if you wanted to lend money to Germany for 10 years, they would pay you an interest rate of 1.2%; the US, 1.6%. And if you wanted to lend Switzerland money for 10 years in December, they were paying a whopping 0.4%. Japan? 0.45%.

And in the case of Japan in particular, they are working very hard to devalue their currency, to make sure the yen falls in value. So the question is, who in their right mind would lend to these countries for such a pittance in interest, especially while most of them are printing money to intentionally debase the value of their currencies!?! You get a very poor interest rate and, if you get your capital back, it will be in a currency that will have fallen in value over 10 years. Yet, that is what institutions and people are doing. Recently, if you wanted to get a reasonable interest rate on 10-year government bonds, then you would have lend money to the country of Rwanda; they paid 7% on a recent offering of 10 year bonds. Best of luck getting your capital back 10 years from now.

When this bubble bursts, the consequences will be huge. This is not a bubble in one country, like Japan in 1980, or in one sector of the economy, like tech stocks in 2000, we’re talking about government bonds, worldwide! This is the market that supports military spending, education, transportation, and just about every safety net (in the US: Social Security, Medicare, Food Stamps, Medicaid, Unemployment Insurance, and so forth) on the planet. And you get this paltry interest rate when you might not even get your capital back in 10 years. A number of governments are on a clear trajectory for bankruptcy; there is a good chance that bond buyers will not get their capital back! And yet they lend huge amounts of money to these governments. Especially Baby Boomers, they have been pouring money into bond funds. Just like they poured money into stocks in 2000, and real estate investments in 2006. Oh well.

When do I think the bond bubble will pop? This year! 2013. I don’t think it can last to 2015. In fact, the bubble pop may have already started. And guess which institutions count government bonds as their major “stable” capital: banks. Yet another reason to watch out for the banks!

Furthermore, the solar cycle might actually peak this year. The NASA guy might be wrong about the dual-peak forecast.

What will it mean if this bubble pops? It means interest rates will rise, possibly a lot. This will strongly increase the amount of interest governments must pay on their debts. Their deficits will skyrocket.

Mortgage interest rates are closely tied to the government bond market, so mortgage rates will rise as well. (US mortgage rates rose from 3.88% to 4.35% just over the last week!) And if government deficits skyrocket, programs will need to be cut, so the massive support they are currently providing for the mortgage market will be in jeopardy, threatening even further rate increases.

Still, two cycles that we will discuss in the next post about cycles argue for that 2015 date.

* * *

I would like to make one thing very clear: If you woke up tomorrow and heard that a large “systemically important” international bank had collapsed, causing chaos in the rest of the financial system, and that most banks would be closed for some number of days, would you really be surprised? Probably not. Many people are starting to get the idea that the system is not exactly solid. I am certainly in that camp. So when I talk about August 2013 or some month in 2015 as the month when the real systemic collapse will commence, please know that, in my view, the more-than-sufficient conditions are in place for that full system collapse to happen at any minute. Discussions like the one above are an attempt to get a handle on probabilities. In terms of preparation, acceleration is not to be trifled with: I think that everyone should be doing what they can to be prepared now. If it turns out there is more time for preparation, fabulous, this type of preparation takes awhile and I’m sure we can all use the time. But that time may be short indeed. As the photo at the top of the post shows, when change arrives in your area, it may be monumental change.

Transition Update: Climate, Sea Level, and Weather

Carbon dioxide levels in the atmosphere reached 400 parts per million for the first time in 3 million years:

     Climate Milestone: Earth’s CO2 Level Passes 400 ppm

But something even more important might be emerging. For years, there have been some who predicted that when the Arctic sea ice melted, that the tremendous quantities of methane stored in the Arctic sea floor above Russia and North America would begin to be released into the atmosphere. The process would become an escalating feedback loop where the retracting ice reflected less sunshine back into space, the open water absorbed more sunlight, heating the water, forcing the ice to retract further, etc. Then the increasingly warming water would warm the sea floor, releasing the methane frozen there.

The methane release is considered to be important in the extreme because, as a greenhouse gas, methane is said to be twenty times more influential than carbon dioxide; and the amount of methane stored in the Arctic is said to have more heat-producing capacity than all of the other fossil fuels combined. Whether that quantity claim is perfectly accurate or not, it is agreed that there’s a lot of methane there.

The release of the methane would then accelerate the feedback loop by rapidly warming the atmosphere so that ultimately people would be calculating sea level rise in meters per decade rather than centimeters.

Now a multi-nation task force claims that there has been a dramatic increase in methane emissions in the Arctic. They say the process has recently escalated beyond their expectations. They believe a runaway feedback loop has likely begun and that the arctic could see an ice-free Summer by 2015 rather than the more generally-accepted predictions that this would not happen till sometime between 2030 and 2050.

Here’s an image showing, from left to right, the average minimum sea ice from 1979-2000; the previous record minimum set in 2007; and the new record set in 2012, from this link:

ArcticSeaIce2012

This gives an indication of the trend, though that trend also includes a persistent and significant thinning of the ice as well, which is not pictured.

Over the last year, those who monitor Arctic methane using aircraft flyovers say that large plumes of methane, some as wide as a kilometer, can be detected above both open Arctic sea water and cracks in the sea ice. This is a new development. Previously, only small plumes could be detected, and typically only near the Siberian coast where methane was escaping from melting permafrost on land. Strong methane emissions from the ocean floor can be seen in the 19 minute video Arctic Methane: Why The Sea Ice Matters. The video does an excellent job of explaining a lot of this and notes that, like many other places on the planet (see What is the Transition? Part 1), the Arctic is seeing an increase in seismic activity that could contribute to additional methane releases.

More can be read about this topic here.

These folks are also studying how changes in the Arctic are causing or contributing to global weather extremes. While I was writing the What is the Transition series, one of the largest storms ever seen developed in the Atlantic, stretching from Canada to Portugal, Greenland to the Caribbean:

     Incredible North Atlantic storm spans Atlantic Ocean, coast to coast

Storm_20130328

Because there was no human body count, the mainstream media ignored it, so few heard about this late-March megastorm. It did contribute to unusually wintry weather in the UK, killing many animals there.

Saturn also had a mega-storm, so some of the energies we are encountering are likely related to our Solar System, not just our planet:

     First Images of Giant Hurricane Swallowing Saturn

Back on Earth, the flooding from storms just keeps on coming:

     Update: ‘Tsunami of rain’ hits Buenos Aires – Death toll rises to 54 as millions left without power and water – Event was ‘deluge without historical precedent’

     Texas floods as up to seven inches of rain falls after storms hit much of the South

     Flash floods kill 16 in Saudi Arabia after heaviest rainfall in 25 years

     Evacuations ordered as flooding hits eastern France

     Nearly a foot of rain falls in Jackson County, Mississippi

     Death toll from north Afghanistan flash flooding rises to 20

     Record flooding threatens Midwest, Mississippi river

And John Stevanovic continues to produce monthly video summaries of weather extremes, earth changes, meteors, and so forth. I do not agree with his “end of the world” belief—as stated previously, I think we are in a major transition that will ultimately result in better times for humanity—but John’s videos do show compelling evidence of the accelerating turbulence that is contributing to the change we are experiencing:

     Extreme weather events and Earth Changes in March 2013

     Extreme weather events and Earth Changes, April 2013

And if you are reading this in mid-May, 2013, you might wish to check in daily with Spaceweather.com. Sunspot AR1748 has already thrown off four X-class solar flares. Luckily, the CMEs (coronal mass ejections) from those flares have not been sent directly toward Earth, but the rotation of the Sun is bringing AR1748 into more direct alignment with the Earth in the coming days. Images of the four X-class flares are here.

What is the Transition? Part 2

An Important Weather SHIFT

This is not a contribution to the raging global warming debate in which some people who pretend to be civilized threaten those who disagree with them with torture and death.

And it’s about a weather trend, not what happened last week in one place.

This is about a global weather shift. And if this shift is correctly described below, then it has major consequences. But almost no one is talking about it.

In their local areas, this shift has been apparent to North American gardeners for years, as they have been increasingly able to grow plants farther north than previously possible. The first map below is the USDA (US Dept. of Agriculture) Plant Hardiness Zone map published in 1990. It told gardeners what plants would survive in their geographical zone, but gardeners learned to “cheat” the zones in recent years, growing plants rated for one zone south of their garden. The second map below was a revised zone map published by the Arbor Day Foundation in 2006 because they knew the USDA 1990 map was seriously out of date (the maps are from Mother Jones):

USDA1990ArborDay2006Notice how Zones 3 and 4, for example, shifted north, in some places by hundreds of miles, indicating warmer temperatures farther north.

In 2012, the USDA published their own new zone map and admitted that the “new map is generally one 5-degree Fahrenheit half-zone warmer than the previous map throughout much of the United States.” So they admitted that the lowest temperature to be expected in many areas was five degrees F greater in 2012 than it was in 1990!

That same warming trend was bringing heat and drought farther north each year. For a decade, Northern Mexico has been struggling with heat and drought. In 2010 and 2011, this condition moved into Texas with a vengeance, bringing scorching heat and a lot of wildfires. In 2011, the wildfires spread to New Mexico and Arizona, with Colorado often experiencing smoke from these fires. In 2012, winter temperatures averaged six to seven degrees F above normal in Colorado, and by Spring, the fires arrived en masse in Colorado and Utah, and by Summer, even into Wyoming and Montana:

     Colorado farmers are facing disaster

During the Summer, more than 60% of the counties of the lower 48 states of the US were declared drought disaster areas.  And this Winter has been far milder than normal in most of the US:

     U.S. Agriculture Secretary: 2013 already a drought disaster

America’s first official disaster areas of 2013 were designated because 597 counties have experienced severe drought conditions for eight consecutive weeks, according to the U.S. Drought Monitor.

Last year, 2,245 counties in 39 states were declared disasters by the USDA. With continued drought projected for much of the United States, farmers may have another hard year ahead of them.

     2 Great Lakes hit lowest water level on record

…the lakes…declined 17 inches since January 2012.

     Chicago expected to tie record for lack of snow

Chicago’s mild winter reaches another milestone on Tuesday: 319 days without an inch of snow falling.

That ties the record set in 1940. Wednesday will break the record and, with temperatures forecast to surge into the 50s Friday and Saturday, the record streak will continue.

     Low water may halt Mississippi River transport next week

And a good summary:

     2012 was hottest year on record for Lower 48 states

The average temperature was 3.3 degrees higher than in the 20th century…

Last year was the hottest year on record for the contiguous 48 states, marked by near-record numbers of extreme weather events such as drought, wildfire, tornadoes and storms, according to the National Oceanic and Atmospheric Administration.

And surface temperatures in the Arctic have been rising for years. Here is the longer-term chart:

arctice-north-latitudes-surface-temp-trend-annual-thru2011

While the US heats up, Canada’s winters become more mild, and the surface temperature rises in the Arctic, there have been increasingly fierce and deadly winters over the last few years on the other side of the North Pole, especially in eastern Europe. From 2012:

     Europe death toll rises in big freeze

     Blizzards hit eastern Europe hard

And from 2013:

     Pyrenees ski resorts top world snow charts with over 7 meters (23 feet) of snowfall in one month

     Heaviest snowfall in many years hits Polish-Slovakian border

     Snowiest winter in 100 years paralyzes Moscow

     New satellite image shows the unusually frigid and snowy conditions that blanketed much of Great Britain

     Heavy snowfall closes dozens of roads in Turkey

     Record snowfall closes lifts and roads in the Pyrenees

     Snowpocalypse Russia: ‘Snow tsunami’ swallows streets, cars, buildings

     Europe hit by blizzards, air traffic havoc, deaths

     Croatia snowfall shatters record set in 1861

     Snow blankets parts of Middle East, Jerusalem

     ‘Lowest temperaure in Bangladesh’s history’ brings at least 80 deaths

     Unprecedented cold spell breaks 50-year records in Pakistan

     Heavy snow, torrential rain, gale-force winds batter Greece

     Russian Trans-Caucasian highway closed due to heavy snowfall

     China’s extreme cold snaps records

     More than 100 dead as cold snap hits India

     Record cold snap grips Korean Peninsula

     Coldest winter in decades for Russia with snow as much as 5 meters (16½ ft) deep – Plows cannot reach roads to clear them

And I can go back to 2012 headlines and find a lot more of the same, though, as usual (as always???), the trend accelerated in 2013.

Admittedly, claiming trend changes for weather is a dicey business. Weather has a knack for frustrating those who declare trends. But there is strong evidence for a rather persistent procession of heat marching north toward the geographic North Pole in the Western Hemisphere and cold moving south from the Pole in the Eastern Hemisphere.

So, if that’s right, what could be the cause?

Well, there’s another well-known phenomenon making a similar directional march. Here are some graphics from ModernSurvivalBlog.com that track the movement of the magnetic North Pole, with the data supplied by conventional scientific organizations such as NOAA. Here is an animated gif of the movement over the last 400 years:

magneitic-north-pole-shift-400-years (1)

And here’s the last 150 years:

magneitic-north-pole-shift-50-year-periods-last-150-years

And over the last 50 years:
magnetic-north-pole-is-heading-to-russia

From the creator of these graphics:

Since 1860, the magnetic pole shift has more than doubled every 50 years…During the past 10 years, the magnetic north pole has shifted nearly half of the total distance of the past 50 years!

Here’s another way to look at the accelerated movement:

MagneticPoleShiftHistory

Where is the pole heading? In the direction of Siberia. All this is not woo-woo information, airports that paint magnetic compass readings on their runways are having to repaint those number every several years.

What’s happening is that, depending on where you are, a compass reading can change by one degree every five years.

The magnetic South Pole is doing the same type of movement away from the geographic South Pole, having moved off the land mass of Antarctica years ago.

Most simplified graphics of the Earth’s magnetic field look something like this:

Earth_geomag

So the question is: Is weather moving with the movement of the magnetic poles? Another way to frame the question: At the magnetic poles, the Earth’s magnetic field captures charged particles flowing from the Sun on the solar wind and directs them toward the surface, an effect visible in the extreme northern and southern latitudes as the Aurora Borealis and Aurora Australis. Is the same energetic pattern also delivering the coldness of space to the planet’s surface? Or is it the relative thinness of the magnetosphere at the magnetic poles?

Well, if it’s correct that this coldness is moving with the magnetic poles, why should anyone care? Because if substantial coldness is moving away from the traditional locations of the geographic poles in Arctic and the Antarctic, then it would seem that the ice at the geographic poles would melt far more quickly than most would expect before equivalent new formations of ice could develop, particularly in the South Pacific where there is no landmass nearby. Perhaps I am uninformed, but I have not heard that such an effect is being accounted for in anyone’s climate change model. And as shown at the beginning of this post, the movement of heat north through North America from the south is proceeding rapidly. If this continues, or more likely accelerates, there might be a whole lot more melting of polar ice caps than previously expected, raising sea levels faster than almost anyone anticipates.

And perhaps my effort above was feeble, but there is a lot of evidence out there for this weather shift. So why are so few talking about it? Clearly, because it doesn’t fit people’s models of how things work. Magnetic pole movement is straight out of conventional science, while the idea that it would impact the weather is not. The solution for most? Ignore the evidence.

What is the Transition? Part 3 is here.