I have made reference to “the Transition.” Before trying to describe its essence, it will be useful to first review aspects of the Transition, in other words, some of its identifiable characteristics. One aspect that runs through all of the others is acceleration, as you will see.
EARTH CHANGES
EARTHQUAKES
Below is a chart of how much shaking the planet has experienced from strong earthquakes for the last 30 years. This chart sums up the Richter values for all earthquakes of magnitude 6.0 or greater for each year. The earthquakes are summed rather than simply counted so that larger earthquakes have slightly greater weight on the chart. To show the trend, the column for each year shows the 10-year average of all that shaking. The trend is unmistakable—things started to really scale up in the early 1990’s:
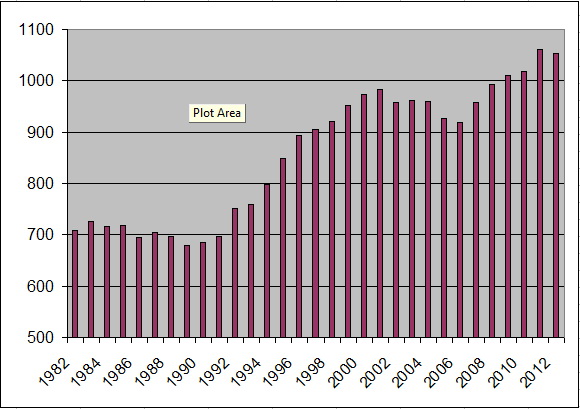
The data for this chart was assembled from a straightforward query of the USGS (US Geological Survey) database at their Global Earthquake Search page.
After the massive Japan earthquake and aftershocks of 2011 (it is worth watching this video graphical display of the world’s 2011 earthquakes, especially if you live in the Ring of Fire), there were fewer earthquakes in 2012. However, 2013 is off to a very fast start, as shown in part in this link from Feb 2:
Earth reeling from eight major earthquakes striking in 5 days
And since that post on Feb 2, there have been an 8.0, a 7.0, a 6.4, and a 6.3 in the Solomon Islands, a 6.9 in Japan, and a 6.9 in Columbia.
TSUNAMIS
Earth doesn’t typically see a lot of large tsunamis, but their occurrence has ramped up fivefold in recent years. According to data at the NOAA Global Historical Tsunami Database, which has records going back to 2000 BC, there have been 34 tsunamis with a wave height greater than twenty feet over the last 400 years. Six of those, or 18%, have occurred since the year 2000:
| Year | Location | Water Height | Deaths |
| 2000 | GREENLAND | 50.0 | |
| 2004 | INDONESIA | 50.9 | 226,898 |
| 2006 | INDONESIA | 20.9 | 802 |
| 2009 | SAMOA | 22.4 | 192 |
| 2010 | CHILE | 29.0 | 156 |
| 2011 | JAPAN | 38.9 | 15,854 |
In the Twentieth Century, there was a tsunami with a twenty foot wave height about once every ten years. In this century, it has happened once every two years, resulting in the deaths of a quarter million people despite the fact that none of these tsunamis struck a major city. The NOAA’s database shows that even a tsunami less than five feet in height can kill thousands. With 23% of the world’s people living in what is called the “near coastal zone,” tsunamis are likely the single most life-threatening Earth-change phenomenon on the planet.
VOLCANISM
Due to the great behavioral variations of active volcanoes, the tracking of volcanism is not as mathematically rigorous as that for earthquakes and tsunamis. There is a site jointly sponsored by the Smithsonian and the USGS that reports on volcanic activity in the latest week. Here is their list for the week of 30 January–5 February 2013:
New Activity/Unrest:
- Colima, México
- Etna, Sicily (Italy)
- Paluweh, Lesser Sunda Islands (Indonesia)
- Rabaul, New Britain
- Reventador, Ecuador
- White Island, New Zealand
Ongoing Activity:
- Batu Tara, Komba Island (Indonesia)
- Chirpoi, Kuril Islands (Russia)
- Copahue, Central Chile-Argentina border
- Karymsky, Eastern Kamchatka (Russia)
- Kilauea, Hawaii (USA)
- Kizimen, Eastern Kamchatka (Russia)
- Lokon-Empung, Sulawesi
- Sakura-jima, Kyushu
- Santa María, Guatemala
- Shiveluch, Central Kamchatka (Russia)
- Tolbachik, Central Kamchatka (Russia)
So, their list is all from the Pacific Rim and Italy. According to some who track this carefully, after a total of 77 volcanic eruptive events for all of the year 2012, there were 44 volcanic eruptive events recorded just in the month of January 2013.
Here are some volcano-related headlines shown on the SOTT.NET Earth Changes page in just the last couple of weeks:
The Great Awakening? Ten volcanoes awaken in one week
Indonesia’s Mount Lokon volcano shaken by double eruptions
Puyehue-Cordon Caulle volcano erupts in Chile
Tavurvur volcano erupts in Papua New Guinea, ash cloud diverts flights
Hawaii’s Mount Kilauea lava lake hits new record high
Manam volcano (Papua New Guinea): Large explosive eruption sending ash plume to 45,000 ft altitude
Campi Flegrei supervolcano raising anxiety among Italian residents
WEATHER EXTREMES (Storms, Floods, Heat Waves, etc.)
Does anyone on the planet need to be told that storms are ramping up in size, intensity, and frequency, resulting in unprecedented flooding? And that heat waves have taken on new intensities and duration? Is there anyone still claiming, “It’s just the internet, nothing has changed, we just have better reporting.”? Anyone making such claims would be well-advised to review the recent history of the global insurance industry. The venerable Lloyd’s of London almost went bankrupt in the mid-1990’s after 350 years of annual profits. They said they had to completely revamp their weather catastrophe calculations because the actuarial data on which they had relied for 300 years (!) was no longer applicable.
Below are some quotes from September 2010 on the web site of Munich Reinsurance, the largest re-insurance company in the world. Reinsurers sell insurance to other insurance companies to cover catastrophic losses:
Munich Re’s natural catastrophe database, the most comprehensive of its kind in the world, shows a marked increase in the number of weather-related events. For instance, globally there has been a more than threefold increase in loss-related floods since 1980 and more than double the number of windstorm natural catastrophes…
Prof. Peter Höppe, Head of Munich Re’s Geo Risks Research/Corporate Climate Centre: “It’s as if the weather machine had changed up a gear.”
Heavy rain and flash floods are affecting not only people living close to rivers but also those who live well away from traditionally flood-prone areas.
And then things accelerated further. By October 2012, Munich Re reported that the numbers were even larger. They reported that weather-related loss events in North America had grown fivefold over the past three decades, and that there was “an increase factor of 4 in Asia, 2.5 in Africa, 2 in Europe, and 1.5 in South America.”
There are literally thousands of headlines available to demonstrate this idea further, here are just a few:
Cyclone frequency in Indonesia increases 28-fold since 2002
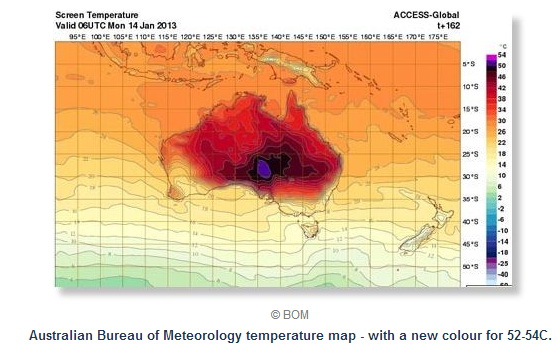
Global warming – or something much worse? Australia adds new colour to temperature maps
The temperature forecast for next Monday by Australia’s Bureau of Meteorology is so unprecedented – over 52C – that it has had to add a new colour to the top of its scale, a suitably incandescent purple.
Tornado slams into Italian steel plant – video
To give you an idea how rare tornadoes are in Italy, four tornadoes in total were recorded in the 17th, 18th and 19th centuries, three were recorded in the 20th century and four were recorded since 2008 alone, with two of those coming in 2012.
And the damage is not limited to single instances, it is cumulative in many areas, for example, the US East Coast:
Former USGS scientist: Coastal cities are ‘sitting ducks’ for next big storm
“We have left our coasts sitting ducks, and Sandy destroyed these natural protections,” she said.
In the space of a few hours, Sandy blew through the sand dunes that had served as natural protections for communities up and down the Atlantic coast.
“Basically these dunes build up over geologic time, and yet the superstorm wore them down over a couple of days, and it is going to take geologic time again to build them back up,” McNutt said.
For those who are more video oriented, this youtube poster does a good job of grabbing news video of weather extremes and earth changes from around the world each month. These can be useful to watch since they can remind just how quickly, under the tremendous distraction of daily life, we forget what’s been happening:
Extreme Weather Events and Earth Changes DECEMBER 2012
The November installment includes Superstorm Sandy. Since the news media typically won’t cover a weather story unless there is a body count to report, few are aware that Lower Manhattan in New York City is still seriously impaired, with skyscrapers running from emergency generators on the street because their basements are still flooded.
RISING TIDES – WITH PERPLEXITY THE SEA AND WAVES ROARING NOVEMBER 2012
FIRE AND ICE – EXTREME WEATHER EVENTS AND EARTH CHANGES JANUARY 2013
(While I applaud SOTT.NET and the maker of the youtubes above, fidockave213, for their excellent work at collecting earth change information, I am not aligned with their editorial views.)
Part 2 describes a huge weather shift taking place on the planet that almost no one is talking about!

Pingback: Guest Post: Your Plan | Thundering-Heard
Absolutely important to share this information, this knowledge!
Grateful for the work you have done on compiling it!
I am sharing it!
Pingback: What is the Transition? Part 4 | Thundering-Heard
Pingback: What is the Transition? Part 6 | Thundering-Heard
Pingback: We Interrupt this Program… | Thundering-Heard
Pingback: What is the Transition? Conclusion | Thundering-Heard
Pingback: Transition Update: Climate, Sea Level, and Weather | Thundering-Heard
Pingback: A Forecast for the Next Eleven Years | Thundering-Heard
Pingback: Who says a person can’t change the world | Thundering-Heard
Pingback: In Praise of Plug-In Vehicles | Thundering-Heard
Pingback: The Weather Gets Even Wilder | Thundering-Heard
Pingback: Earth changes statistical update | Thundering-Heard
Pingback: A New Direction | Thundering Heard